

Walmart shares test resistance at $114.49 amid conflicting chart signals: weekly analysis

Shares of Walmart Inc. (WMT) are trading near $113 after an advance of just over 1% for the week as a recent rally runs into overbought conditions. While the price action signals some conflicting momentum on the chart, technicals suggest the stock could be entering a consolidation phase as buyers and sellers reassess direction for the coming week.
 126.62
131.69
Highlights
- Shares of Walmart gained 1.1% over the past 7 days to $112.93, trading above the 20-day average but below longer-term levels.
- Technical momentum is mixed, with strong sell signals from MACD countered by overbought signals, indicating choppy short-term sentiment.
- Expected trading range for the coming week is $111.14 to $117.32, with support at $112.44 and resistance at $114.49.
Acquisition, earnings prospects, and refunds drive sentiment amid portfolio moves
Walmart announced the completion of its acquisition of Vibe.co, a self-service streaming TV advertising platform, which expands the reach of Walmart Connect's advertising business, according to MarketScreener on August 10, 2026. The company is expected to report fiscal second-quarter earnings on August 20, and is also set to receive roughly $2.4 billion in tariff refunds following a Supreme Court ruling, as noted by Yahoo Finance and Simply Wall St. Additionally, Franklin Street Advisors Inc. NC sold a portion of its holdings in WMT during the second quarter, according to MarketBeat on August 10, 2026.
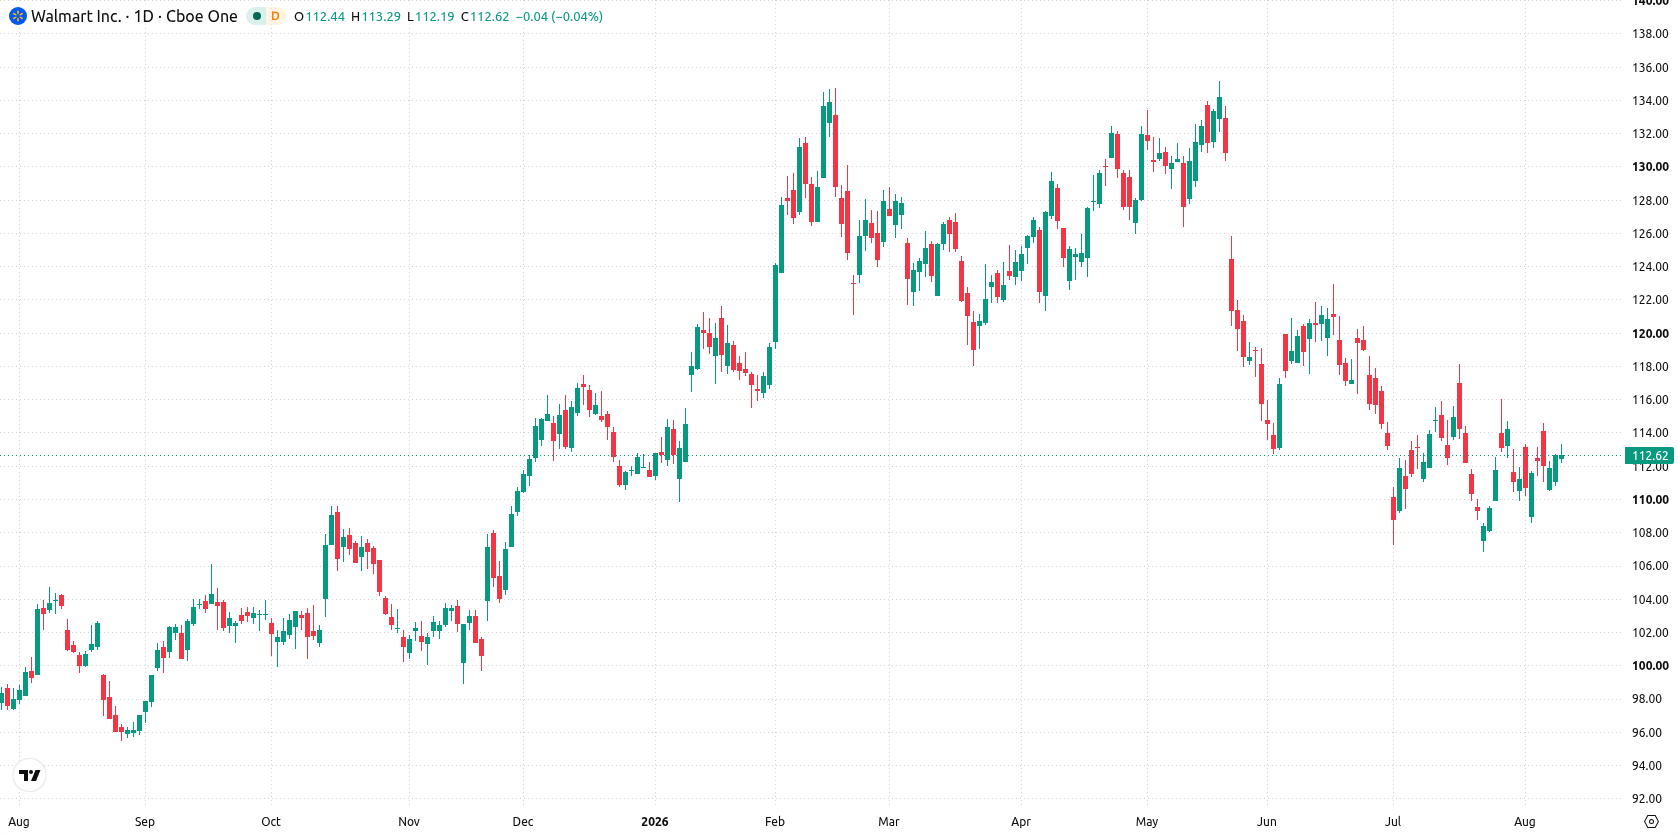
Flat trend and mixed momentum highlight range-bound setup this week
The daily chart presents a flat trend and a contained move within a narrow range, with volatility over the past week at 3.62%. Momentum signals are mixed: MACD indicates a strong sell while Bull/Bear Power shows an overbought bias, highlighting some divergence in short-term sentiment. Immediate support is found at the Ichimoku Kijun of $112.44, with resistance at the 50-day moving average of $114.49. This setup suggests Walmart shares are likely to consolidate within established boundaries as cross currents in momentum play out.
Downside risk prevails as consolidation expected within defined range
Over the coming trading week, the expected range is $111.14 to $117.32, with a 40% probability of an increase and a 60% probability of a decrease. The base case is for the stock to oscillate between $112.44 support and $114.49 resistance. A move above $114.49 could open room toward the upper end of the projected range at $117.32. Conversely, a drop below $112.44 would expose the stock to further downside toward $111.14.
Previously it was reported that rebalancing and constituent changes in major equity indices can influence trading activity and fund allocations across affected stocks. With Walmart now completing a strategic acquisition, preparing for earnings, and facing a technical consolidation zone, traders should monitor whether a move above $114.49 or below $112.44 establishes the next direction for the coming sessions.











-
 Afghanistan
-
 Albania
-
 Algeria
-
 Angola
-
 Argentina
-
 Armenia
-
 Australia
-
 Austria
-
 Azerbaijan
-
 Bahamas
-
 Bahrain
-
 Bangladesh
-
 Belarus
-
 Belgium
-
 Bolivia
-
 Botswana
-
 Brazil
-
 Brunei
-
 Bulgaria
-
 Cambodia
-
 Cameroon
-
 Canada
-
 Chile
-
 China
-
 Colombia
-
 Congo
-
 Costa Rica
-
 Cote d'Ivoire
-
 Croatia
-
 Cuba
-
 Cyprus
-
 Czechia
-
 DR Congo
-
 Denmark
-
 Dominican Republic
-
 Ecuador
-
 Egypt
-
 El Salvador
-
 Estonia
-
 Eswatini
-
 Ethiopia
-
 Finland
-
 France
-
 Georgia
-
 Germany
-
 Ghana
-
 Greece
-
 Haiti
-
 Hong Kong
-
 Hungary
-
 India
-
 Indonesia
-
 Iran, Islamic republic
-
 Iraq
-
 Ireland
-
 Israel
-
 Italy
-
 Jamaica
-
 Japan
-
 Jordan
-
 Kazakhstan
-
 Kenya
-
 Korea
-
 Kuwait
-
 Kyrgyzstan
-
 Laos
-
 Latvia
-
 Lebanon
-
 Lesotho
-
 Libya
-
 Lithuania
-
 Luxembourg
-
 Madagascar
-
 Malaysia
-
 Malta
-
 Mauritius
-
 Mexico
-
 Moldova
-
 Mongolia
-
 Montenegro
-
 Morocco
-
 Mozambique
-
 Myanmar
-
 Namibia
-
 Nepal
-
 Netherlands
-
 New Zealand
-
 Nigeria
-
 North Macedonia
-
 Norway
-
 Oman
-
 Pakistan
-
 Palestine
-
 Panama
-
 Papua New Guinea
-
 Paraguay
-
 Peru
-
 Philippines
-
 Poland
-
 Portugal
-
 Puerto Rico
-
 Qatar
-
 Reunion
-
 Romania
-
 Rwanda
-
 Saudi Arabia
-
 Serbia
-
 Singapore
-
 Slovakia
-
 Slovenia
-
 Somalia
-
 South Africa
-
 Spain
-
 Sri Lanka
-
 Sweden
-
 Switzerland
-
 Syria
-
 Taiwan
-
 Tajikistan
-
 Tanzania
-
 Thailand
-
 Trinidad and Tobago
-
 Tunisia
-
 Turkey
-
 UAE
-
 Uganda
-
 Ukraine
-
 United Kingdom
-
United States
-
 Uruguay
-
 Uzbekistan
-
 Venezuela
-
 Vietnam
-
 Yemen
-
 Zambia
-
 Zimbabwe
- Forex
- Crypto












