

What's behind Gartner's latest 3.2% stock pullback?

Gartner Inc (IT) slid 3.22% as sellers pressured the stock, even as the company's strong Q2 earnings and an expanded buyback authorization provided a positive backdrop. The downside move is further underlined by Gartner trading above its short- and medium-term moving averages, which limits the decline amid ongoing overbought technical signals.
 211.54
211.54
211.54
Highlights
- Gartner contract value rose 2% year over year to $5.3 billion in Q2 2026, with results surpassing Wall Street expectations on higher client engagement and retention.
- Gartner reduced share count by more than 5% through $547 million of stock buybacks, with authorization increased to $1.2 billion.
- Gartner stock trades with short- and medium-term bullish momentum but is currently near support at $186.85, with overbought signals and an expected range of $179.17 to $194.73 in the next five sessions.
Bullish earnings and robust buybacks counter broad market selling
Gartner reported accelerated contract value growth in Q2 2026, reaching $5.3 billion for a 2% year-over-year increase and a sequential rise from Q1. Share count was reduced by more than 5% following $547 million in stock repurchases, with the Board raising the buyback authorization to around $1.2 billion. Quarterly results topped Wall Street expectations due to improved client engagement and retention, particularly among midsized enterprises and the public sector, though price action has remained under broader selling pressure.
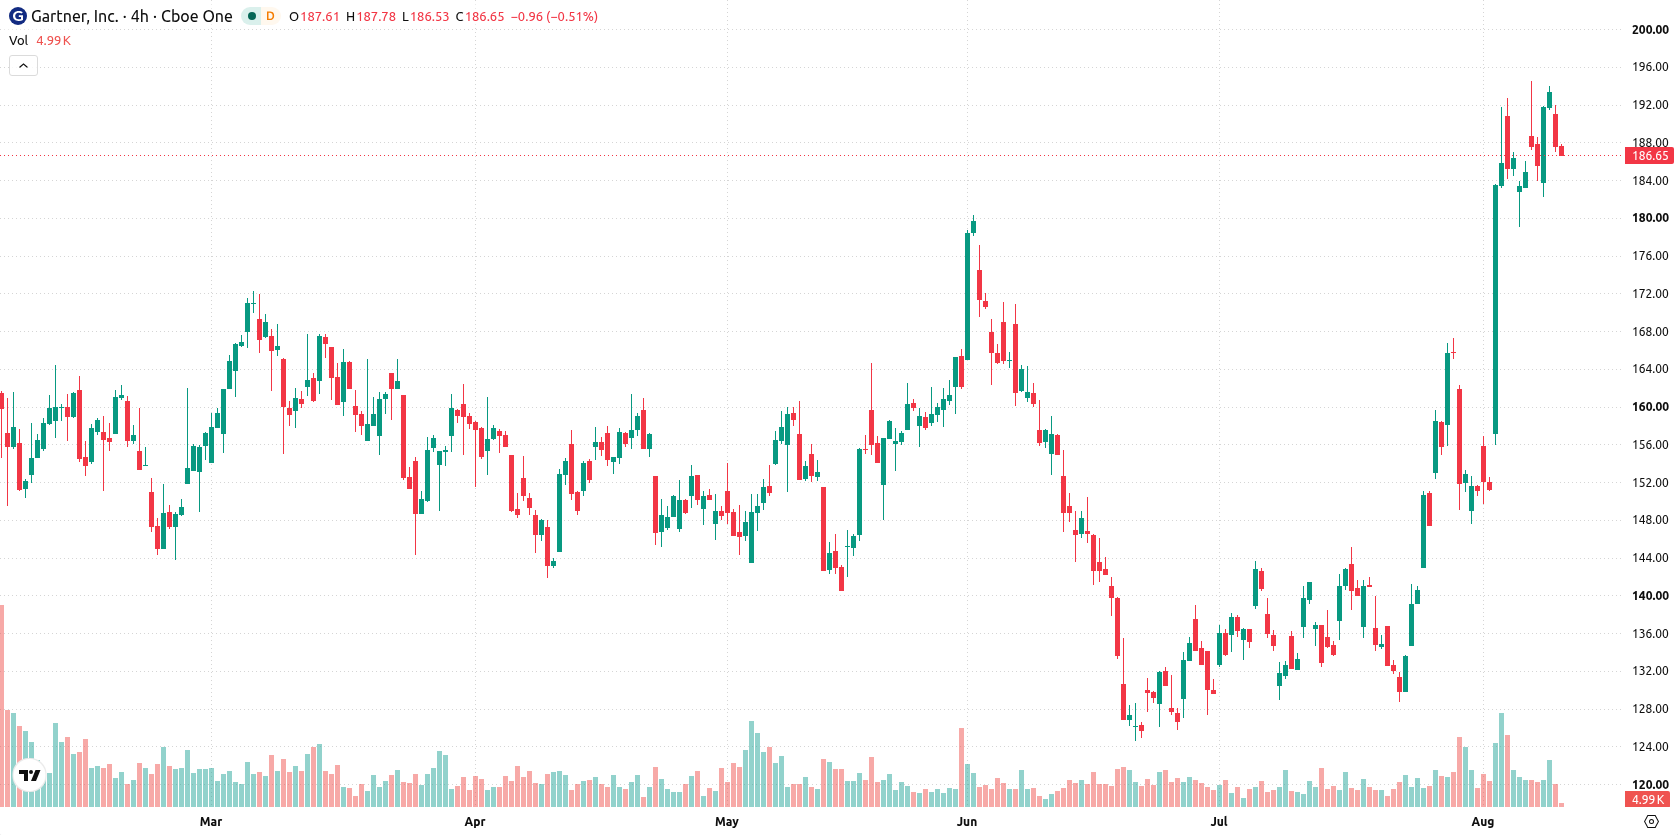
Short-term bullish trend faces caution as momentum and overbought signals diverge
Gartner is trading above its 20-day, 50-day, and 200-day moving averages ($154.61, $148.22, and $182.26), which indicates short- and medium-term bullish momentum and longer-term support. The current near-term ceiling stands at $191.25 (today’s high), with support at $186.85 (today’s low). The broader trend context remains constructive, despite a bearish long-term alignment between the 50-day and 200-day moving averages. Momentum readings are mixed, with both MACD and Average Directional Index forecasting further gains, while the Relative Strength Index signals overbought conditions at 73.17. Stochastic RSI, Commodity Channel Index, and Bull/Bear Power also indicate overbought territory, with buyers dominating the intraday tape. The Awesome Oscillator aligns with the bullish bias. Price is currently near the session’s low, and intraday volatility stands at 2.35%. Intraday tone is cautious with pressure after the open as short-term momentum and overbought signals diverge.
Earlier, analysts noted that Gartner’s earnings beat and increased buybacks were driving strong bullish momentum, though caution was warranted given technical overbought signals and lingering resistance. The current move lower in price extends this narrative by highlighting the elevated probability of further volatility, with the key level to watch now at the $191.25 ceiling for signs of renewed upside momentum.





Latest Gartner Inc News





-
 Afghanistan
-
 Albania
-
 Algeria
-
 Angola
-
 Argentina
-
 Armenia
-
 Australia
-
 Austria
-
 Azerbaijan
-
 Bahamas
-
 Bahrain
-
 Bangladesh
-
 Belarus
-
 Belgium
-
 Bolivia
-
 Botswana
-
 Brazil
-
 Brunei
-
 Bulgaria
-
 Cambodia
-
 Cameroon
-
 Canada
-
 Chile
Chile
-
 China
China
-
 Colombia
-
 Congo
Congo
-
 Costa Rica
-
 Cote d'Ivoire
-
 Croatia
-
 Cuba
Cuba
-
 Cyprus
-
 Czechia
-
 DR Congo
-
 Denmark
-
 Dominican Republic
-
 Ecuador
-
 Egypt
Egypt
-
 El Salvador
-
 Estonia
-
 Eswatini
-
 Ethiopia
-
 Finland
-
 France
-
 Georgia
-
 Germany
-
 Ghana
Ghana
-
 Greece
-
 Haiti
Haiti
-
 Hong Kong
-
 Hungary
-
 India
India
-
 Indonesia
-
 Iran, Islamic republic
-
 Iraq
Iraq
-
 Ireland
-
 Israel
-
 Italy
Italy
-
 Jamaica
-
 Japan
Japan
-
 Jordan
-
 Kazakhstan
-
 Kenya
Kenya
-
 Korea
Korea
-
 Kuwait
-
 Kyrgyzstan
-
 Laos
Laos
-
 Latvia
-
 Lebanon
-
 Lesotho
-
 Libya
Libya
-
 Lithuania
-
 Luxembourg
-
 Madagascar
-
 Malaysia
-
 Malta
Malta
-
 Mauritius
-
 Mexico
-
 Moldova
-
 Mongolia
-
 Montenegro
-
 Morocco
-
 Mozambique
-
 Myanmar
-
 Namibia
-
 Nepal
Nepal
-
 Netherlands
-
 New Zealand
-
 Nigeria
-
 North Macedonia
-
 Norway
-
 Oman
Oman
-
 Pakistan
-
 Palestine
-
 Panama
-
 Papua New Guinea
-
 Paraguay
-
 Peru
Peru
-
 Philippines
-
 Poland
-
 Portugal
-
 Puerto Rico
-
 Qatar
Qatar
-
 Reunion
-
 Romania
-
 Rwanda
-
 Saudi Arabia
-
 Serbia
-
 Singapore
-
 Slovakia
-
 Slovenia
-
 Somalia
-
 South Africa
-
 Spain
Spain
-
 Sri Lanka
-
 Sweden
-
 Switzerland
-
 Syria
Syria
-
 Taiwan
-
 Tajikistan
-
 Tanzania
-
 Thailand
-
 Trinidad and Tobago
-
 Tunisia
-
 Turkey
-
 UAE
UAE
-
 Uganda
-
 Ukraine
-
 United Kingdom
-
United States
-
 Uruguay
-
 Uzbekistan
-
 Venezuela
-
 Vietnam
-
 Yemen
Yemen
-
 Zambia
-
 Zimbabwe
- Forex
- Crypto












