

Broadcom stock weekly forecast: Range holds with support at $397.37 as buyers watch resistance

Shares of Broadcom Inc. (AVGO) are trading near $417, after slipping about 2.5% over the past week as a recovery setup faces pressure from recent product and corporate news. With support holding so far, the next week will turn on how the stock digests these developments and whether continued cooling momentum gives way to further losses or a bounce.
 328.80
351.95
Highlights
- Shares of Broadcom fell 2.5% to $416.64 over the past week but remain above key moving averages, indicating a constructive long-term trend.
- Technical signals are mixed with MACD positive and HMA forecasting a sell, and Bull/Bear Power in overbought territory showing waning upside momentum.
- Broadcom stock is expected to consolidate in a range of $410.76 to $432.73, with 71% probability of an increase in the coming week.
Security upgrades and alliance news counter downgrade-driven sentiment shift this week
Broadcom announced major updates to its VMware vDefend and Avi Load Balancer products on August 6, 2026, aiming to enhance security and automation for VMware Cloud Foundation private clouds, according to Yahoo Finance and Simply Wall St. The company also became a founding member of the Open Secure AI Alliance alongside NVIDIA and others, deepening its push into AI and cybersecurity. At the same time, Bank of America downgraded AVGO based on credit concerns surrounding its XPV platform, adding pressure, while CEO Hock Tan reaffirmed Broadcom’s $100 billion AI revenue forecast, mostly sourced from six primary customers.
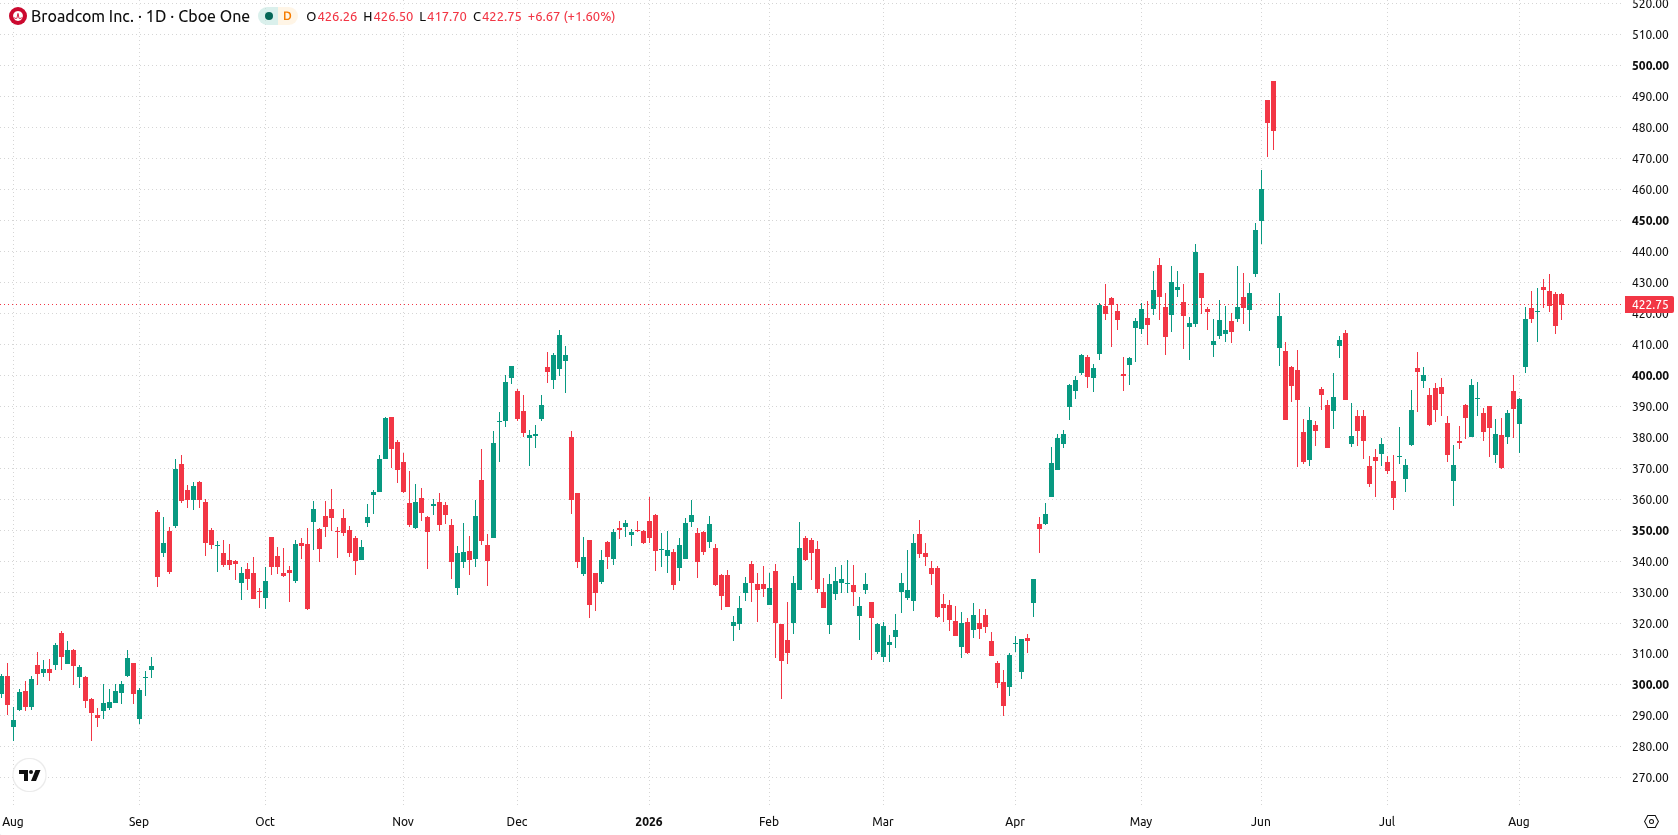
Range-bound price action holds as mixed momentum signals heighten caution
On the daily chart, the structure shows the stock pulling back toward the lower part of its recent range, while still maintaining its position above all key moving averages. Momentum signals are mixed: MACD remains positive and in a buy direction, but the HMA forecast has turned to sell, highlighting a divergence. Bull/Bear Power reads 16.29 and is in the overbought zone, suggesting upside momentum is losing steam. Volatility over the past week registered 5.35%. With the Ichimoku Kijun at $397.37 acting as support and resistance marked at $432.73 from the recent high, the overall move appears contained, consistent with a move within a narrow range.
Consolidation favored next week as breakout risks hinge on key levels
For the coming trading week, expected action should stay between $406.81 and $426.46, with a 71% probability of an increase versus a 29% chance of a decrease. The base scenario is consolidation between $410.76 and $432.73, anchored by support at the weekly low and resistance at the recent high. A sustained push above $432.73 would open up additional short-term upside. If shares slip below $410.76, a pullback toward the $406.81 level comes into focus.
Previously it was reported that Broadcom's bullish outlook was underpinned by ongoing product enhancements and industry partnerships, particularly in the AI and security segments. The current technical picture highlights a consolidating range, with support at $410.76 and resistance at $432.73 now serving as the key trading levels to monitor in the coming week.









-
 Afghanistan
-
 Albania
-
 Algeria
-
 Angola
-
 Argentina
-
 Armenia
-
 Australia
-
 Austria
-
 Azerbaijan
-
 Bahamas
-
 Bahrain
-
 Bangladesh
-
 Belarus
-
 Belgium
-
 Bolivia
-
 Botswana
-
 Brazil
-
 Brunei
-
 Bulgaria
-
 Cambodia
-
 Cameroon
-
 Canada
-
 Chile
-
 China
-
 Colombia
-
 Congo
-
 Costa Rica
-
 Cote d'Ivoire
-
 Croatia
-
 Cuba
-
 Cyprus
-
 Czechia
-
 DR Congo
-
 Denmark
-
 Dominican Republic
-
 Ecuador
-
 Egypt
-
 El Salvador
-
 Estonia
-
 Eswatini
-
 Ethiopia
-
 Finland
-
 France
-
 Georgia
-
 Germany
-
 Ghana
-
 Greece
-
 Haiti
-
 Hong Kong
-
 Hungary
-
 India
-
 Indonesia
-
 Iran, Islamic republic
-
 Iraq
-
 Ireland
-
 Israel
-
 Italy
-
 Jamaica
-
 Japan
-
 Jordan
-
 Kazakhstan
-
 Kenya
-
 Korea
-
 Kuwait
-
 Kyrgyzstan
-
 Laos
-
 Latvia
-
 Lebanon
-
 Lesotho
-
 Libya
-
 Lithuania
-
 Luxembourg
-
 Madagascar
-
 Malaysia
-
 Malta
-
 Mauritius
-
 Mexico
-
 Moldova
-
 Mongolia
-
 Montenegro
-
 Morocco
-
 Mozambique
-
 Myanmar
-
 Namibia
-
 Nepal
-
 Netherlands
-
 New Zealand
-
 Nigeria
-
 North Macedonia
-
 Norway
-
 Oman
-
 Pakistan
-
 Palestine
-
 Panama
-
 Papua New Guinea
-
 Paraguay
-
 Peru
-
 Philippines
-
 Poland
-
 Portugal
-
 Puerto Rico
-
 Qatar
-
 Reunion
-
 Romania
-
 Rwanda
-
 Saudi Arabia
-
 Serbia
-
 Singapore
-
 Slovakia
-
 Slovenia
-
 Somalia
-
 South Africa
-
 Spain
-
 Sri Lanka
-
 Sweden
-
 Switzerland
-
 Syria
-
 Taiwan
-
 Tajikistan
-
 Tanzania
-
 Thailand
-
 Trinidad and Tobago
-
 Tunisia
-
 Turkey
-
 UAE
-
 Uganda
-
 Ukraine
-
 United Kingdom
-
United States
-
 Uruguay
-
 Uzbekistan
-
 Venezuela
-
 Vietnam
-
 Yemen
-
 Zambia
-
 Zimbabwe
- Forex
- Crypto












