

Why is Axon stock falling today? Sellers take control, key support levels to watch

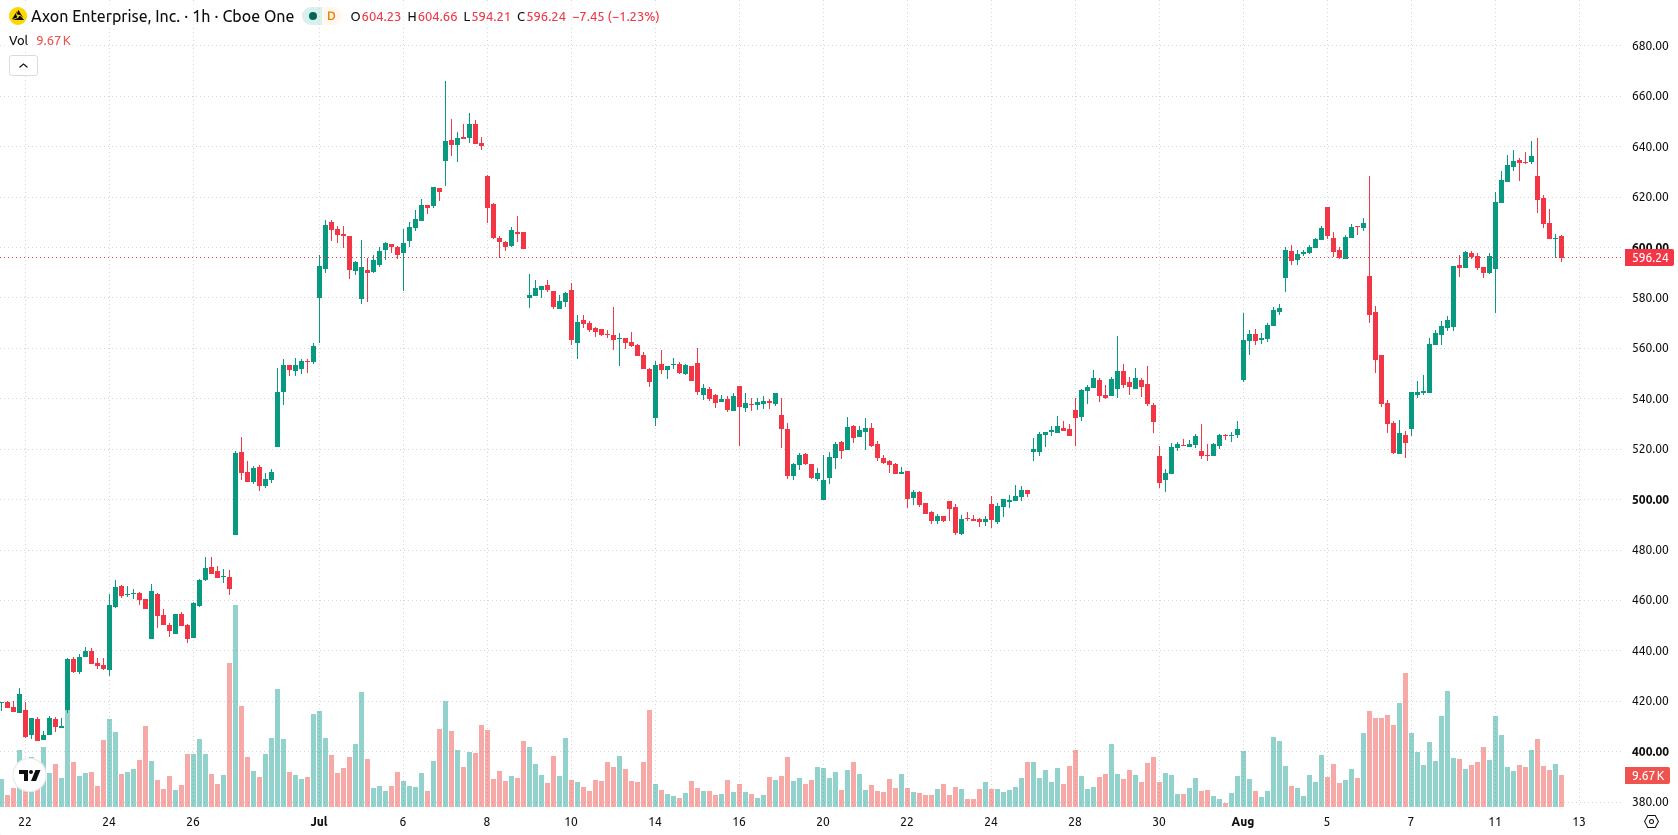
Axon (AXON) stock is trading at $595.18 after a daily decline of 6.46%. The price has slipped below its short-term moving average but is still holding above medium- and long-term average levels.
 318.45
319.86
Highlights
- Axon Enterprise delivered a 35.3% year-over-year revenue increase to $904.39 million with contracted bookings up 41% to $15 billion.
- The company raised its 2026 full-year revenue growth forecast to 32 to 34% and reported a sharp increase in AI Era Plan revenue.
- Shares of Axon closed down 6.46% with high volatility, trading between $538.67 and $651.69 as short-term indicators signal intraday selling pressure but medium- and long-term trend strength remains bullish.
Revenue surges and forward guidance lifted amid broad market selling
Axon Enterprise reported strong second-quarter results with revenue of $904.39 million, marking a 35.3% increase year over year. This performance was driven by significant growth in Platform Solutions revenue and a nearly sevenfold increase in AI Era Plan revenue, while contracted bookings climbed 41% to $15 billion, further enhancing the company’s revenue visibility. Additionally, the company raised its full-year 2026 revenue growth forecast to 32–34%, underscoring management’s confidence in continued expansion. On August 7, 2026, CEO Patrick Smith executed a pre-planned sale of 70 shares for approximately $39,663, according to Investing.com, though price action has remained under broader selling pressure.
Conflicting momentum signals as technical support holds after sell-off
On the technical front, AXON is trading below its MA-20 but remains above both the MA-50 and long-term MA-200. The Ichimoku Kijun at $583.87 provides immediate support for the stock. MACD and ADX both indicate strong bullish momentum, with RSI in buy territory and Stoch RSI showing oversold conditions, suggesting that the recent intraday sell-off may be exhausted. CCI remains neutral, while both Bull/Bear Power and today's intraday session indicate sellers have dominated, with Awesome Oscillator maintaining a neutral stance—highlighting conflicting signals and uncertainty in very short-term moves.
Sideways trading favored as upside probability outpaces downside risk
Over the next several days, AXON is expected to trade within a volatility band between $538.67 and $651.69. The probability of an up move is estimated at 70%, with downside risk at 30%, leaving a downward break as less likely though still possible. The baseline scenario anticipates sideways action inside the established corridor, while a bullish scenario would see a breakout above $651.69. A bearish scenario remains on the table if immediate support at $583.87 fails and the price tests the lower boundary near $538.67.
Previously it was reported that Axon was exhibiting sustained bullish momentum supported by strong earnings and positive technical trends. The current analysis adds a note of near-term caution, highlighting mixed technical signals and advising readers to closely monitor the $583.87 support level as a potential pivot point for further price action.






Latest Axon Enterprise Inc News




-
 Afghanistan
-
 Albania
-
 Algeria
-
 Angola
-
 Argentina
-
 Armenia
-
 Australia
-
 Austria
-
 Azerbaijan
-
 Bahamas
-
 Bahrain
-
 Bangladesh
-
 Belarus
-
 Belgium
-
 Bolivia
-
 Botswana
-
 Brazil
-
 Brunei
-
 Bulgaria
-
 Cambodia
-
 Cameroon
-
 Canada
-
 Chile
-
 China
-
 Colombia
-
 Congo
-
 Costa Rica
-
 Cote d'Ivoire
-
 Croatia
-
 Cuba
-
 Cyprus
-
 Czechia
-
 DR Congo
-
 Denmark
-
 Dominican Republic
-
 Ecuador
-
 Egypt
-
 El Salvador
-
 Estonia
-
 Eswatini
-
 Ethiopia
-
 Finland
-
 France
-
 Georgia
-
 Germany
-
 Ghana
-
 Greece
-
 Haiti
-
 Hong Kong
-
 Hungary
-
 India
-
 Indonesia
-
 Iran, Islamic republic
-
 Iraq
-
 Ireland
-
 Israel
-
 Italy
-
 Jamaica
-
 Japan
-
 Jordan
-
 Kazakhstan
-
 Kenya
-
 Korea
-
 Kuwait
-
 Kyrgyzstan
-
 Laos
-
 Latvia
-
 Lebanon
-
 Lesotho
-
 Libya
-
 Lithuania
-
 Luxembourg
-
 Madagascar
-
 Malaysia
-
 Malta
-
 Mauritius
-
 Mexico
-
 Moldova
-
 Mongolia
-
 Montenegro
-
 Morocco
-
 Mozambique
-
 Myanmar
-
 Namibia
-
 Nepal
-
 Netherlands
-
 New Zealand
-
 Nigeria
-
 North Macedonia
-
 Norway
-
 Oman
-
 Pakistan
-
 Palestine
-
 Panama
-
 Papua New Guinea
-
 Paraguay
-
 Peru
-
 Philippines
-
 Poland
-
 Portugal
-
 Puerto Rico
-
 Qatar
-
 Reunion
-
 Romania
-
 Rwanda
-
 Saudi Arabia
-
 Serbia
-
 Singapore
-
 Slovakia
-
 Slovenia
-
 Somalia
-
 South Africa
-
 Spain
-
 Sri Lanka
-
 Sweden
-
 Switzerland
-
 Syria
-
 Taiwan
-
 Tajikistan
-
 Tanzania
-
 Thailand
-
 Trinidad and Tobago
-
 Tunisia
-
 Turkey
-
 UAE
-
 Uganda
-
 Ukraine
-
 United Kingdom
-
United States
-
 Uruguay
-
 Uzbekistan
-
 Venezuela
-
 Vietnam
-
 Yemen
-
 Zambia
-
 Zimbabwe
- Forex
- Crypto












