

Fiscal Q3 earnings scheduled August 13, 2026: Can AMAT break $578.98 resistance?

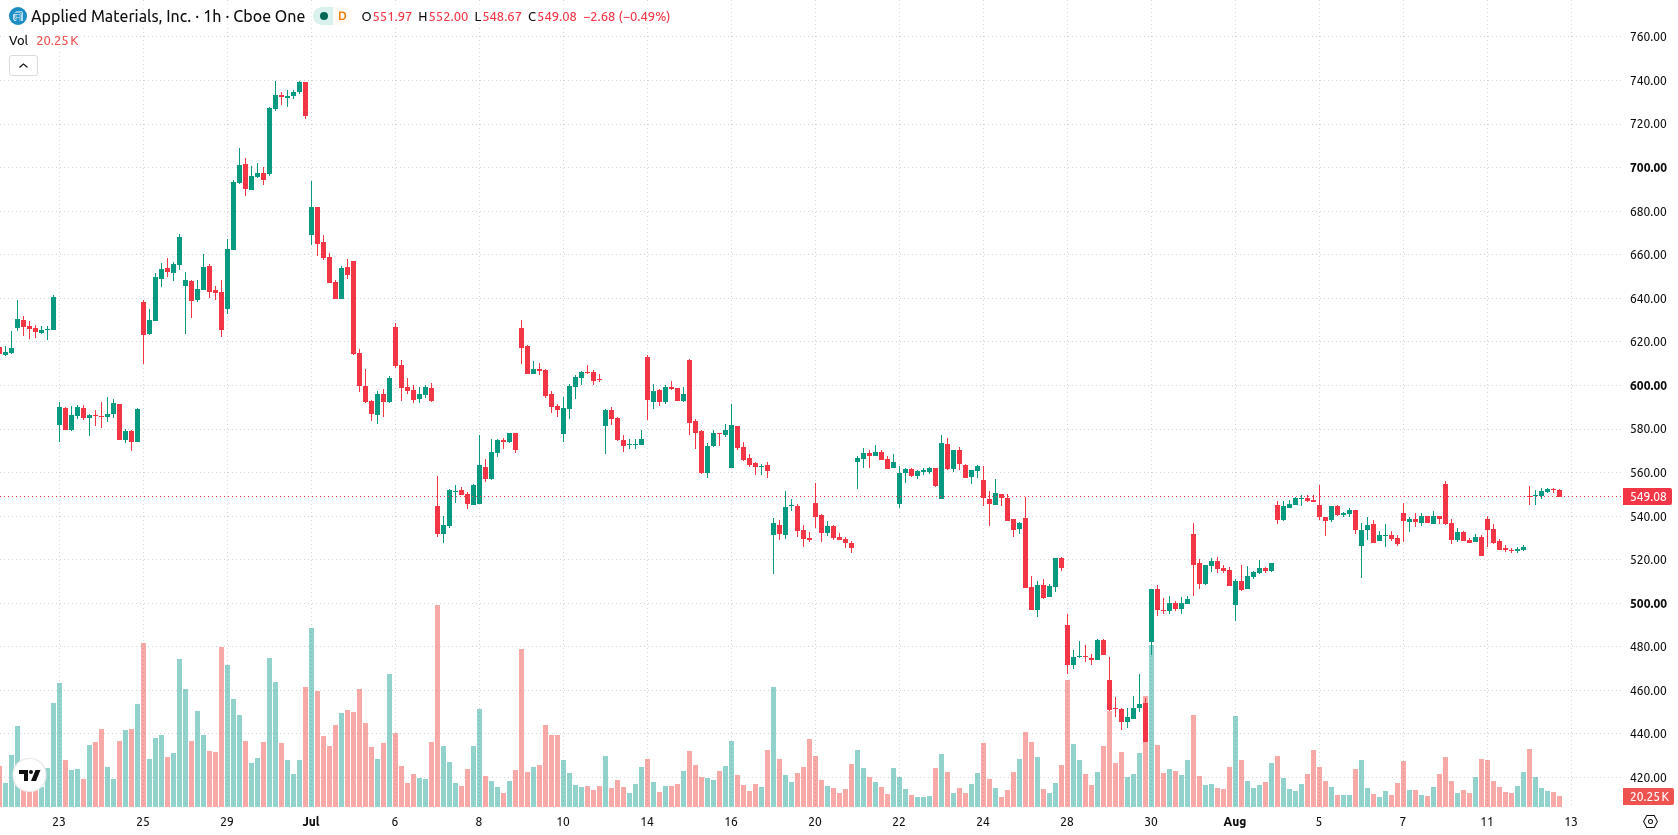
Applied Materials (AMAT) stock is trading at $548.67, up 4.39% for the session. The price currently holds above its key short- and medium-term moving averages, reflecting underlying strength in today’s trading.
 405.20
426.52
Highlights
- Applied Materials projects fiscal third-quarter revenue of approximately $8.95 billion, targeting strong AI-driven chip equipment demand.
- UC Berkeley joining the EPIC Center expands the company’s research and development capacity for semiconductor innovation.
- Shares of Applied Materials trade in a bullish structure above key moving averages, with a forecasted range of $528.87 to $578.98 and 79% probability of further upside.
Investor positioning shifts as AI demand and research expansion loom
Applied Materials is set to release its fiscal third-quarter results after the market close on August 13, 2026, drawing investor focus to upcoming earnings as the primary near-term catalyst. Company guidance calls for approximately $8.95 billion in quarterly revenue, reflecting expectations of robust AI-driven semiconductor equipment demand, according to Stockstory. Additionally, the recent announcement that UC Berkeley will join the EPIC Center, as reported by Globenewswire, expands Applied Materials' research and development capacity in chip innovation. These developments frame a supportive backdrop for price action as the market positions ahead of earnings.
Overbought signals temper bullish momentum above major technical support
Technically, AMAT is positioned above the MA-20 and MA-50 on the hourly chart and trades comfortably above the MA-200 on the daily timeframe. The Ichimoku Kijun on the daily chart marks immediate support at $538.73, while the forecast trading range is defined between support at $528.87 and resistance at $578.98. MACD remains in buy mode and ADX is neutral, suggesting persistent, though not aggressive, momentum. RSI stands at 65.57, with Stoch RSI, CCI, and Bull/Bear Power all signaling overbought conditions intraday, and the Awesome Oscillator is neutral, indicating that while positive momentum persists, the market may face short-term resistance due to overbought signals.
Consolidation favored as bullish odds meet earnings-driven volatility risk
In the short term, AMAT is expected to trade between $528.87 and $578.98, with a baseline scenario favoring consolidation within this range given typical volatility. Probability leans toward a further upside at 79%, reflecting prevailing bullish momentum, while the chance of a downward move is seen at 21%. A break above the resistance could trigger new highs, whereas a sustained move below immediate support would open room for a deeper pullback. Investors should closely monitor the upcoming earnings release for potential volatility triggers.
Earlier, analysts noted that Applied Materials was demonstrating constructive long-term technical patterns, supported by sector tailwinds and the expansion of its research partnership with UC Berkeley. The current setup further strengthens that perspective, with bullish momentum prevailing ahead of earnings and the key area to watch now being a breakout or reversal near the $578.98 resistance level.






Latest Applied Materials News




-
 Afghanistan
-
 Albania
-
 Algeria
-
 Angola
-
 Argentina
-
 Armenia
-
 Australia
-
 Austria
-
 Azerbaijan
-
 Bahamas
-
 Bahrain
-
 Bangladesh
-
 Belarus
-
 Belgium
-
 Bolivia
-
 Botswana
-
 Brazil
-
 Brunei
-
 Bulgaria
-
 Cambodia
-
 Cameroon
-
 Canada
-
 Chile
-
 China
-
 Colombia
-
 Congo
-
 Costa Rica
-
 Cote d'Ivoire
-
 Croatia
-
 Cuba
-
 Cyprus
-
 Czechia
-
 DR Congo
-
 Denmark
-
 Dominican Republic
-
 Ecuador
-
 Egypt
-
 El Salvador
-
 Estonia
-
 Eswatini
-
 Ethiopia
-
 Finland
-
 France
-
 Georgia
-
 Germany
-
 Ghana
-
 Greece
-
 Haiti
-
 Hong Kong
-
 Hungary
-
 India
-
 Indonesia
-
 Iran, Islamic republic
-
 Iraq
-
 Ireland
-
 Israel
-
 Italy
-
 Jamaica
-
 Japan
-
 Jordan
-
 Kazakhstan
-
 Kenya
-
 Korea
-
 Kuwait
-
 Kyrgyzstan
-
 Laos
-
 Latvia
-
 Lebanon
-
 Lesotho
-
 Libya
-
 Lithuania
-
 Luxembourg
-
 Madagascar
-
 Malaysia
-
 Malta
-
 Mauritius
-
 Mexico
-
 Moldova
-
 Mongolia
-
 Montenegro
-
 Morocco
-
 Mozambique
-
 Myanmar
-
 Namibia
-
 Nepal
-
 Netherlands
-
 New Zealand
-
 Nigeria
-
 North Macedonia
-
 Norway
-
 Oman
-
 Pakistan
-
 Palestine
-
 Panama
-
 Papua New Guinea
-
 Paraguay
-
 Peru
-
 Philippines
-
 Poland
-
 Portugal
-
 Puerto Rico
-
 Qatar
-
 Reunion
-
 Romania
-
 Rwanda
-
 Saudi Arabia
-
 Serbia
-
 Singapore
-
 Slovakia
-
 Slovenia
-
 Somalia
-
 South Africa
-
 Spain
-
 Sri Lanka
-
 Sweden
-
 Switzerland
-
 Syria
-
 Taiwan
-
 Tajikistan
-
 Tanzania
-
 Thailand
-
 Trinidad and Tobago
-
 Tunisia
-
 Turkey
-
 UAE
-
 Uganda
-
 Ukraine
-
 United Kingdom
-
United States
-
 Uruguay
-
 Uzbekistan
-
 Venezuela
-
 Vietnam
-
 Yemen
-
 Zambia
-
 Zimbabwe
- Forex
- Crypto












