

What's behind AST SpaceMobile's latest 3.3% stock pullback?

AST SpaceMobile, Inc. (ASTS) dropped 3.25% after reporting disappointing second quarter 2026 earnings, with a wider non-GAAP net loss and missing revenue estimates. The move is supported by technically bearish signals, as the stock remains below its 50-day and 200-day moving averages even amid short-term strength above its 20-day average.
 29.16
36.90
Highlights
- AST SpaceMobile stock posted a non-GAAP net loss of $0.44 per share and $31.52 million in revenue for the second quarter of 2026, both missing analyst estimates.
- Operating expenses rose to $329.1 million as the company increased spending on infrastructure and R&D, with a BB7 satellite launch incident contributing to a $125.9 million GAAP loss.
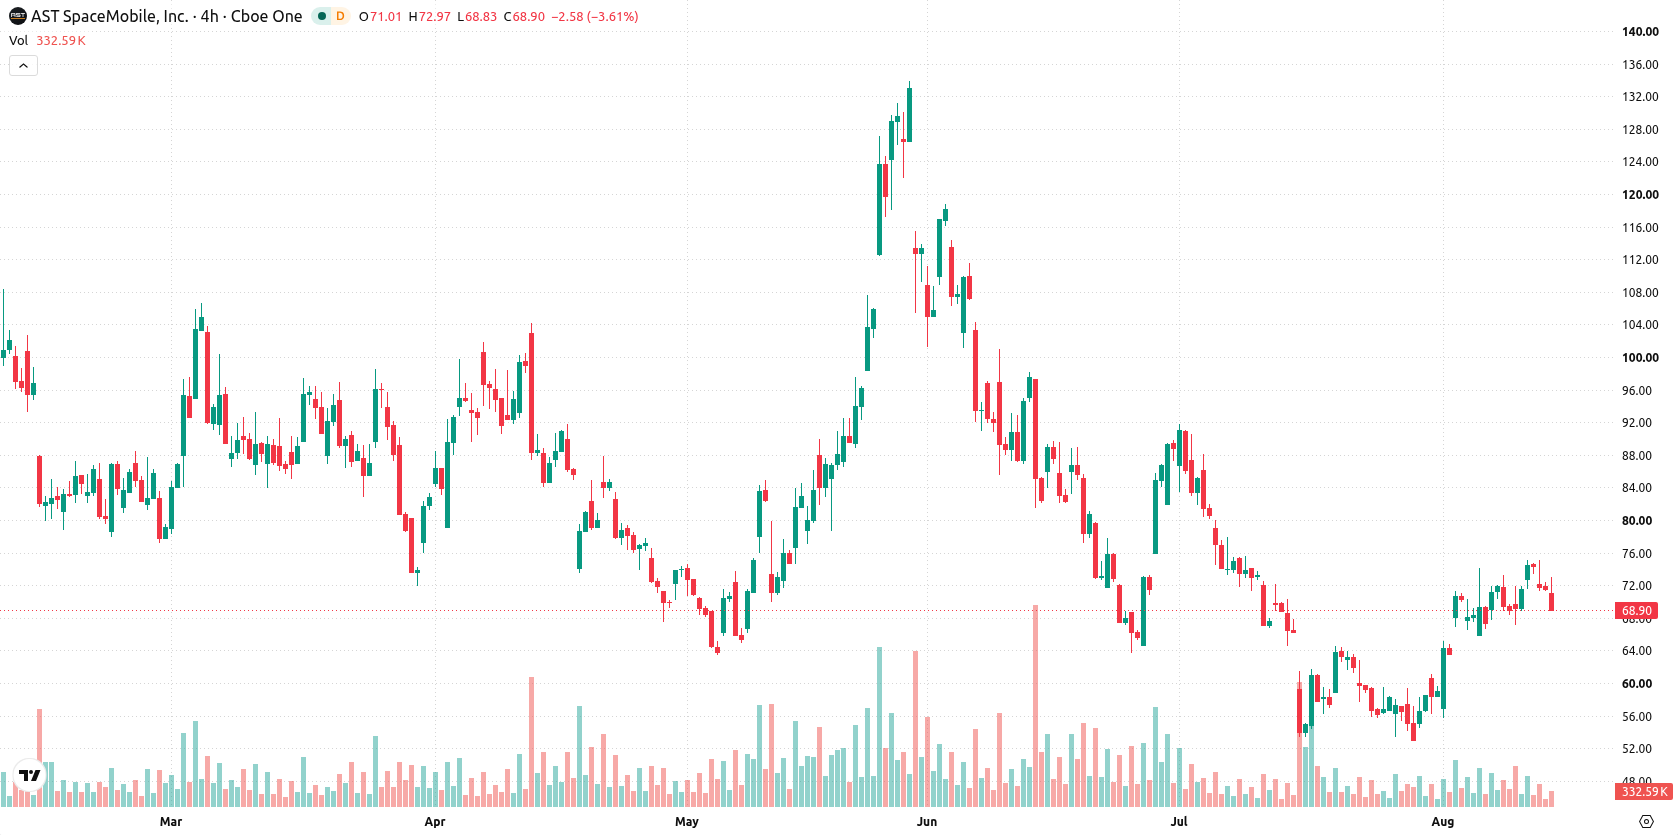
- Shares traded at $69.19, near session lows and below key medium- and long-term levels, with a 62% likelihood of movement toward $65.19 over the next week.
Revenue miss and satellite setback fuel selling despite expansion efforts
AST SpaceMobile reported second quarter 2026 financial results that fell below expectations, with a non-GAAP net loss of $0.44 per share and revenue of $31.52 million, both missing consensus estimates. Operating expenses climbed to $329.1 million due to investments in infrastructure and R&D as the company ramps up deployment of its direct-to-smartphone satellite broadband network. A BB7 satellite launch incident contributed to a $125.9 million GAAP loss, alongside macroeconomic headwinds. Expansion plans and efforts to increase control over satellite launches were noted, though price action has remained under broader selling pressure.
Bearish trend persists as short-term buyers face mixed momentum
AST SpaceMobile is trading above its 20-day moving average (MA-20) at $63.45, but remains below both the 50-day (MA-50) at $73.88 and 200-day (MA-200) at $81.94. This setup signals short-term strength but suggests that medium- and longer-term sellers still drive the trend, with overall bearish alignment between MA-50 and MA-200. Resistance is found at $69.7, while support is at $67.08. Momentum indicators are mixed: the MACD and ADX are neutral, the RSI reads 53.46 with a Buy signal, but the Stochastic RSI, CCI, and Bull/Bear Power (BBP) indicate overbought conditions favoring buyers in the immediate term. The Awesome Oscillator also supports a bullish bias. On the day, ASTS trades near session lows with a downside gap and intraday volatility of 4.35%. Downward pressure persisted after the open, creating a divergence from some bullish oscillator signals.
Earlier, analysts noted that AST SpaceMobile faced mounting profitability concerns and ambiguous technical signals as spending pressures weighed on price action. The latest data reinforce these challenges, with persistent downward pressure keeping ASTS below critical long-term moving averages and traders advised to monitor support at $67.08 for renewed downside risk.






Latest AST SpaceMobile News



-
 Afghanistan
-
 Albania
-
 Algeria
-
 Angola
-
 Argentina
-
 Armenia
-
 Australia
-
 Austria
-
 Azerbaijan
-
 Bahamas
-
 Bahrain
-
 Bangladesh
-
 Belarus
-
 Belgium
-
 Bolivia
-
 Botswana
-
 Brazil
-
 Brunei
-
 Bulgaria
-
 Cambodia
-
 Cameroon
-
 Canada
-
 Chile
-
 China
-
 Colombia
-
 Congo
-
 Costa Rica
-
 Cote d'Ivoire
-
 Croatia
-
 Cuba
-
 Cyprus
-
 Czechia
-
 DR Congo
-
 Denmark
-
 Dominican Republic
-
 Ecuador
-
 Egypt
-
 El Salvador
-
 Estonia
-
 Eswatini
-
 Ethiopia
-
 Finland
-
 France
-
 Georgia
-
 Germany
-
 Ghana
-
 Greece
-
 Haiti
-
 Hong Kong
-
 Hungary
-
 India
-
 Indonesia
-
 Iran, Islamic republic
-
 Iraq
-
 Ireland
-
 Israel
-
 Italy
-
 Jamaica
-
 Japan
-
 Jordan
-
 Kazakhstan
-
 Kenya
-
 Korea
-
 Kuwait
-
 Kyrgyzstan
-
 Laos
-
 Latvia
-
 Lebanon
-
 Lesotho
-
 Libya
-
 Lithuania
-
 Luxembourg
-
 Madagascar
-
 Malaysia
-
 Malta
-
 Mauritius
-
 Mexico
-
 Moldova
-
 Mongolia
-
 Montenegro
-
 Morocco
-
 Mozambique
-
 Myanmar
-
 Namibia
-
 Nepal
-
 Netherlands
-
 New Zealand
-
 Nigeria
-
 North Macedonia
-
 Norway
-
 Oman
-
 Pakistan
-
 Palestine
-
 Panama
-
 Papua New Guinea
-
 Paraguay
-
 Peru
-
 Philippines
-
 Poland
-
 Portugal
-
 Puerto Rico
-
 Qatar
-
 Reunion
-
 Romania
-
 Rwanda
-
 Saudi Arabia
-
 Serbia
-
 Singapore
-
 Slovakia
-
 Slovenia
-
 Somalia
-
 South Africa
-
 Spain
-
 Sri Lanka
-
 Sweden
-
 Switzerland
-
 Syria
-
 Taiwan
-
 Tajikistan
-
 Tanzania
-
 Thailand
-
 Trinidad and Tobago
-
 Tunisia
-
 Turkey
-
 UAE
-
 Uganda
-
 Ukraine
-
 United Kingdom
-
United States
-
 Uruguay
-
 Uzbekistan
-
 Venezuela
-
 Vietnam
-
 Yemen
-
 Zambia
-
 Zimbabwe
- Forex
- Crypto












