

Can strong Q2 2026 revenue fuel a Tesla stock rally?

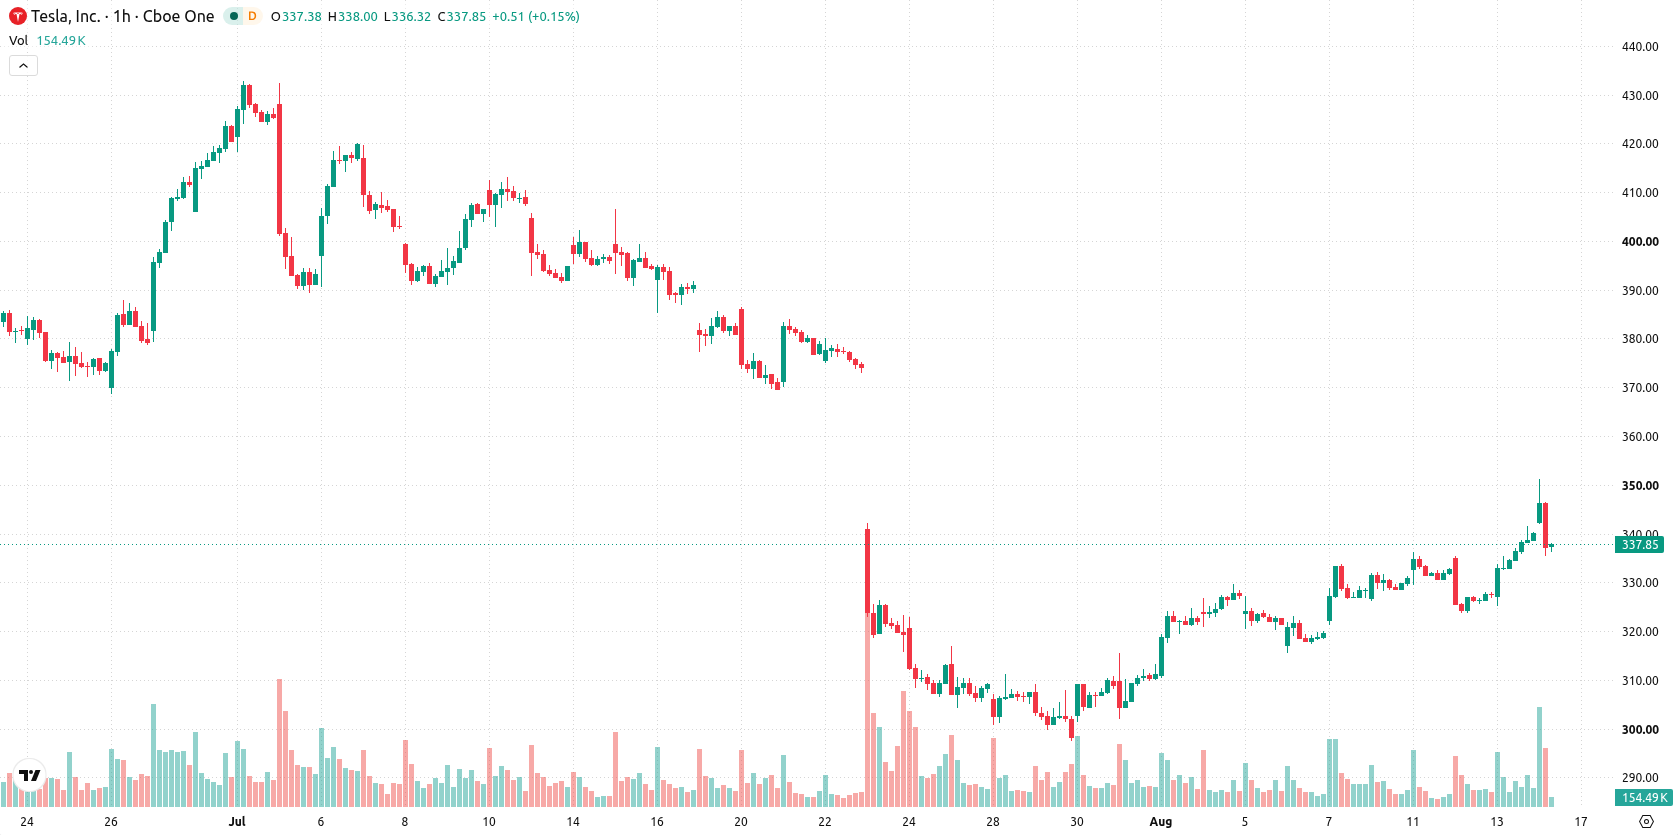
Tesla Inc. (TSLA) stock is trading at $345.39, up 1.76% on the day and extending its advance above key short- and medium-term moving averages while remaining below longer-term trend levels.
 389.27
401.16
Highlights
- Tesla reported Q2 2026 revenue of $28.24 billion, a year-over-year increase of 25.5%, surpassing expectations.
- Earnings per share declined to $0.33 with margin compression and negative free cash flow of $1.09 billion.
- Tesla stock trades with short- and medium-term support, strong momentum signals, and a projected range of $337.36 to $353.42.
Mixed sentiment as revenue beats but margins and cash flow disappoint
Tesla delivered a strong Q2 2026 top-line result by reporting a 25.5% year-over-year revenue increase to $28.24 billion, surpassing expectations and highlighting robust product demand, according to 247wallst. This outperformance signals ongoing consumer interest and sets a positive backdrop for further operational growth. However, results showed earnings per share declined to $0.33, missing consensus, with margin compression and a negative free cash flow of $1.09 billion, potentially moderating bullish sentiment among some investors. Speculation remains regarding a potential merger with SpaceX, as noted by Finance Yahoo, but no official confirmation has been provided.
Short-term momentum clashes with overbought signals and low volatility
Technical analysis highlights TSLA's current standing above the MA-20 and MA-50, with price still below the MA-200, indicating a divergence between short-term strength and longer-term trend. Immediate support is established by the daily Ichimoku Kijun at $332.64, while the short-term range is further outlined by the $337.36 support and $353.42 as resistance. On the indicator side, RSI sits at 69.63, with MACD and ADX both on strong Buy signals, while Bull/Bear Power remains in favor of buyers. Stochastic RSI and CCI both reflect overbought conditions, and the Awesome Oscillator continues to align with the current upward momentum. The proximity of price to today's low despite a gap up, low volatility, and multiple overbought signals introduce a note of caution against further immediate upside.
Range-bound trading seen as technical and volatility cues limit direction
In the short term, TSLA is projected to trade within a range of $337.36 to $353.42. The baseline scenario calls for near-term consolidation inside this band given current volatility and the technical backdrop. A bullish scenario could materialize if price breaks and holds above resistance, potentially triggering an extension of recent gains. Conversely, if support at $332.64 is breached, short-term weakness may unfold, with downside risk emerging accordingly.
Earlier, analysts noted that Tesla's executive compensation plans have had a significant impact on pay structures across corporate America, contributing to widening gaps between CEO and worker pay. The current technical setup suggests that traders should monitor the $332.64 support level closely, as a break below this threshold could introduce new downside risk in the near term.











-
 Afghanistan
-
 Albania
-
 Algeria
-
 Angola
-
 Argentina
-
 Armenia
-
 Australia
-
 Austria
-
 Azerbaijan
-
 Bahamas
-
 Bahrain
-
 Bangladesh
-
 Belarus
-
 Belgium
-
 Bolivia
-
 Botswana
-
 Brazil
-
 Brunei
-
 Bulgaria
-
 Cambodia
-
 Cameroon
-
 Canada
-
 Chile
-
 China
-
 Colombia
-
 Congo
-
 Costa Rica
-
 Cote d'Ivoire
-
 Croatia
-
 Cuba
-
 Cyprus
-
 Czechia
-
 DR Congo
-
 Denmark
-
 Dominican Republic
-
 Ecuador
-
 Egypt
-
 El Salvador
-
 Estonia
-
 Eswatini
-
 Ethiopia
-
 Finland
-
 France
-
 Georgia
-
 Germany
-
 Ghana
-
 Greece
-
 Haiti
-
 Hong Kong
-
 Hungary
-
 India
-
 Indonesia
-
 Iran, Islamic republic
-
 Iraq
-
 Ireland
-
 Israel
-
 Italy
-
 Jamaica
-
 Japan
-
 Jordan
-
 Kazakhstan
-
 Kenya
-
 Korea
-
 Kuwait
-
 Kyrgyzstan
-
 Laos
-
 Latvia
-
 Lebanon
-
 Lesotho
-
 Libya
-
 Lithuania
-
 Luxembourg
-
 Madagascar
-
 Malaysia
-
 Malta
-
 Mauritius
-
 Mexico
-
 Moldova
-
 Mongolia
-
 Montenegro
-
 Morocco
-
 Mozambique
-
 Myanmar
-
 Namibia
-
 Nepal
-
 Netherlands
-
 New Zealand
-
 Nigeria
-
 North Macedonia
-
 Norway
-
 Oman
-
 Pakistan
-
 Palestine
-
 Panama
-
 Papua New Guinea
-
 Paraguay
-
 Peru
-
 Philippines
-
 Poland
-
 Portugal
-
 Puerto Rico
-
 Qatar
-
 Reunion
-
 Romania
-
 Rwanda
-
 Saudi Arabia
-
 Serbia
-
 Singapore
-
 Slovakia
-
 Slovenia
-
 Somalia
-
 South Africa
-
 Spain
-
 Sri Lanka
-
 Sweden
-
 Switzerland
-
 Syria
-
 Taiwan
-
 Tajikistan
-
 Tanzania
-
 Thailand
-
 Trinidad and Tobago
-
 Tunisia
-
 Turkey
-
 UAE
-
 Uganda
-
 Ukraine
-
 United Kingdom
-
United States
-
 Uruguay
-
 Uzbekistan
-
 Venezuela
-
 Vietnam
-
 Yemen
-
 Zambia
-
 Zimbabwe
- Forex
- Crypto












