

Tesla shares contain downside as Ichimoku Kijun support limits decline: weekly analysis

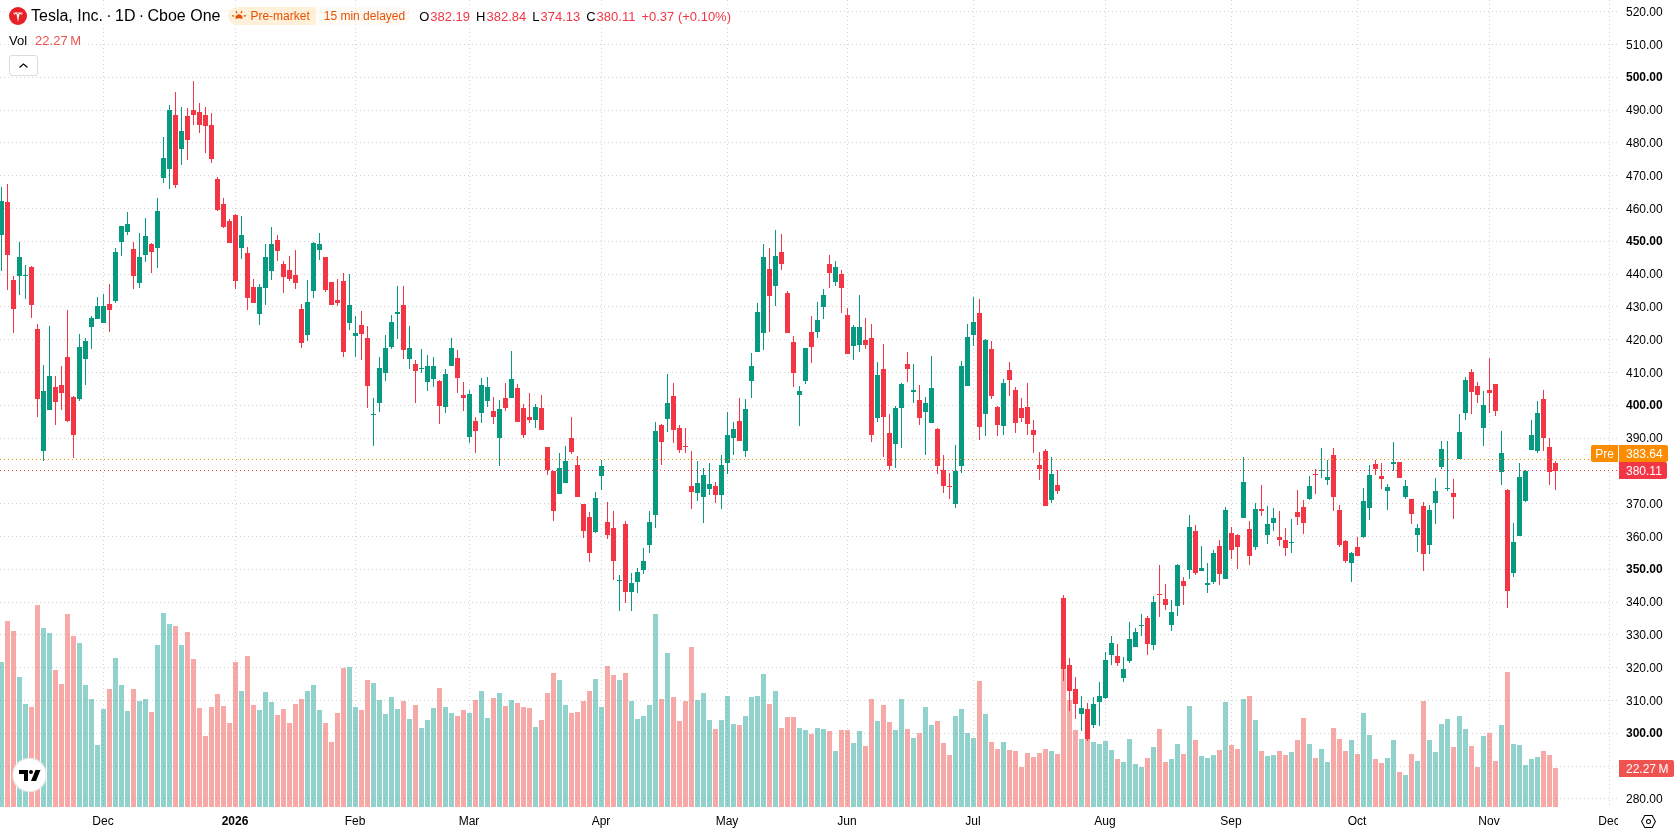
Shares of Tesla, Inc. (TSLA) are trading near $381 after sliding roughly 2% over the past week. The chart reflects a standoff between buyer and seller signals, with mixed momentum and key support and resistance zones still actively in play. This sees the stock entering the new week with a muted directional bias and a continued focus on upcoming catalysts.
 382.84
401.16
Highlights
- Shares of Tesla fell 2.38% over the past week to $380.96, sitting below key long-term moving averages.
- Technical signals are mixed, with the price in a consolidation range and oscillators showing no clear directional bias.
- Key support is at $376.3 and resistance at $382.21, with an expected trading range of $368.93 to $395.44 in the coming week.
Mergers and software rollout drive speculation amid European expansion news
Tesla began rolling out software update 2026.44.1, which includes Full Self-Driving v14.3 Lite for certain eligible vehicles, according to Teslascope and Basenor. There is ongoing speculation reported by Yahoo Finance and Seeking Alpha about a potential all-stock merger between Tesla and SpaceX, though no agreement has been announced. In addition, ChainCatcher reported that Tesla will invest an additional 3 billion euros in its Grünheide factory in Germany, expanding its production footprint in Europe.
Flat trend dominance as neutral oscillators offset bullish MACD signals
On the daily chart, the setup points to a flat trend with a contained move within a narrow range, as volatility over the past week reached 7.18%. Oscillator readings are neutral, with the RSI at 49.63 and CCI at -40.15 offering no clear bias. The MACD supports a firmer undertone with a strong buy direction, while Bull/Bear Power in an oversold state suggests seller dominance. Immediate support stands at $376.3 from the Ichimoku Kijun, and resistance is seen at $382.21, which is also the MA-200 that the stock is currently holding.
Consolidation scenario favored as range boundaries guide next week’s moves
In the week ahead, the expected range is $368.93 to $395.44, with an evenly balanced probability of a move higher or lower at 50%. The base case is for Tesla stock to continue consolidating inside this range, anchored between the Ichimoku Kijun support and MA-200 resistance. A break above $382.21 could open the way for a test toward the $395.44 upper boundary. Conversely, a close below $376.3 would expose the lower end of the range near $368.93.
Previously it was reported that Tesla’s near-term outlook was constrained by technical resistance and macroeconomic uncertainties, particularly regarding potential Federal Reserve policy actions. The latest developments, including the ongoing consolidation and flat trend highlighted by current technical signals, reinforce the prevailing scenario in which traders should monitor the $368.93 to $395.44 range for any decisive break that could set the next directional move.











-
 Afghanistan
-
 Albania
-
 Algeria
-
 Angola
-
 Argentina
-
 Armenia
-
 Australia
-
 Austria
-
 Azerbaijan
-
 Bahamas
-
 Bahrain
-
 Bangladesh
-
 Belarus
-
 Belgium
-
 Bolivia
-
 Botswana
-
 Brazil
-
 Brunei
-
 Bulgaria
-
 Cambodia
-
 Cameroon
-
 Canada
-
 Chile
-
 China
-
 Colombia
-
 Congo
-
 Costa Rica
-
 Cote d'Ivoire
-
 Croatia
-
 Cuba
-
 Cyprus
-
 Czechia
-
 DR Congo
-
 Denmark
-
 Dominican Republic
-
 Ecuador
-
 Egypt
-
 El Salvador
-
 Estonia
-
 Eswatini
-
 Ethiopia
-
 Finland
-
 France
-
 Georgia
-
 Germany
-
 Ghana
-
 Greece
-
 Haiti
-
 Hong Kong
-
 Hungary
-
 India
-
 Indonesia
-
 Iran, Islamic republic
-
 Iraq
-
 Ireland
-
 Israel
-
 Italy
-
 Jamaica
-
 Japan
-
 Jordan
-
 Kazakhstan
-
 Kenya
-
 Korea
-
 Kuwait
-
 Kyrgyzstan
-
 Laos
-
 Latvia
-
 Lebanon
-
 Lesotho
-
 Libya
-
 Lithuania
-
 Luxembourg
-
 Madagascar
-
 Malaysia
-
 Malta
-
 Mauritius
-
 Mexico
-
 Moldova
-
 Mongolia
-
 Montenegro
-
 Morocco
-
 Mozambique
-
 Myanmar
-
 Namibia
-
 Nepal
-
 Netherlands
-
 New Zealand
-
 Nigeria
-
 North Macedonia
-
 Norway
-
 Oman
-
 Pakistan
-
 Palestine
-
 Panama
-
 Papua New Guinea
-
 Paraguay
-
 Peru
-
 Philippines
-
 Poland
-
 Portugal
-
 Puerto Rico
-
 Qatar
-
 Reunion
-
 Romania
-
 Rwanda
-
 Saudi Arabia
-
 Serbia
-
 Singapore
-
 Slovakia
-
 Slovenia
-
 Somalia
-
 South Africa
-
 Spain
-
 Sri Lanka
-
 Sweden
-
 Switzerland
-
 Syria
-
 Taiwan
-
 Tajikistan
-
 Tanzania
-
 Thailand
-
 Trinidad and Tobago
-
 Tunisia
-
 Turkey
-
 UAE
-
 Uganda
-
 Ukraine
-
 United Kingdom
-
United States
-
 Uruguay
-
 Uzbekistan
-
 Venezuela
-
 Vietnam
-
 Yemen
-
 Zambia
-
 Zimbabwe
- Forex
- Crypto












