

Tesla gains while strong inflation data adds pressure to growth valuations

Tesla (TSLA) stock is trading in a modestly positive range as of November 17, 2026, with prices positioned between key trend measures. Market attention remains focused on the outlook for Federal Reserve policy into December.
 382.39
401.16
Highlights
- Higher-than-expected U.S. producer price inflation for October 2026 has increased fears of a December Federal Reserve rate hike.
- Rising rate expectations increase the cost of capital and generally reduce valuations for growth-focused stocks such as TSLA.
- TSLA stock trades in a narrow band with support near $376 and resistance around $382 as technical signals remain mixed.
Rate hike risk from strong U.S. inflation reading
According to Investing.com, a stronger-than-expected U.S. producer price inflation report for October 2026 published on November 16 has sparked concerns that the Federal Reserve may raise interest rates at its upcoming December meeting.
This development raises the cost of capital for high-growth companies and tends to reduce valuation multiples, creating a challenging environment for stocks like TSLA. The risk is transmitted through higher expected yields in financial markets, which directly impacts sentiment toward growth-oriented equities.
While the inflation data creates clear policy risk, it does not represent a policy move itself. The potential rate hike remains conditional and subject to subsequent inflation releases and Federal Reserve guidance.
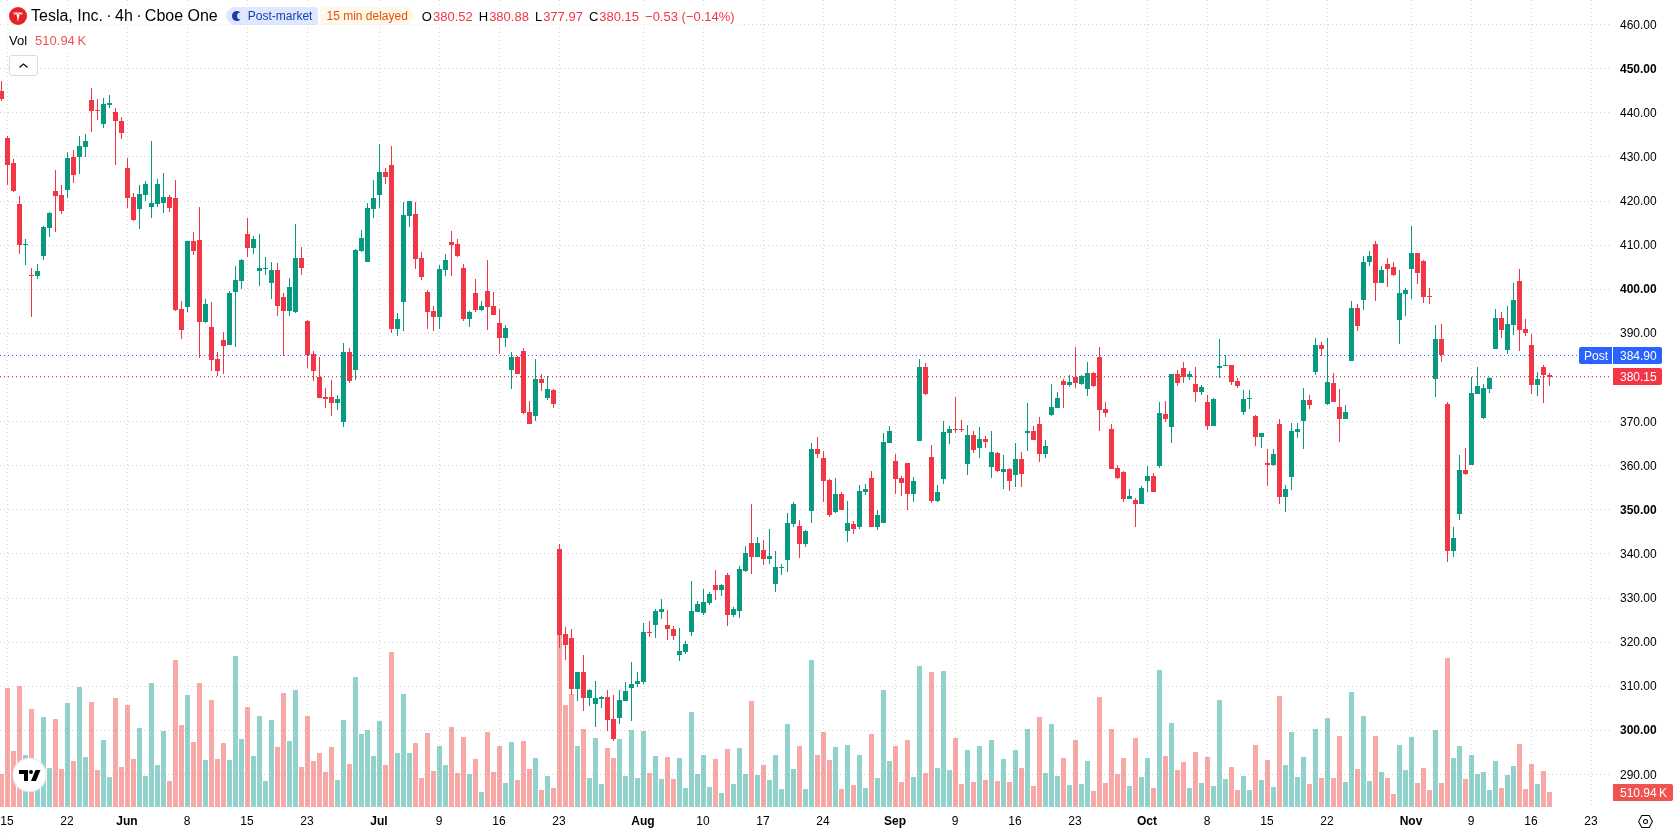
Mixed signals above H4 Kijun, momentum remains neutral
The 4H chart shows TSLA fluctuating near key moving averages, with the D1 SMA-50 at $375.21 acting as a near-term pivot and the D1 SMA-200 at $382.42 limiting upside. Price is currently holding above the H4 Kijun at $376.19, which serves as a support area on this timeframe.
Technical signals are mixed. The MACD shows a mild buy bias, while the ADX suggests neutral underlying momentum. Traders should weigh these short-range signals against policy risks remaining in the background.
Fed policy outcome drives test of $376–$382 range
Further market direction is likely to depend on upcoming U.S. inflation data and Federal Reserve communications ahead of the December meeting. Downside stabilization may occur if TSLA holds support around $376, while resistance is likely near $382. A clear move outside of this band could confirm the next directional bias.
Earlier, analysts noted that Tesla’s near-term outlook was constrained by technical resistance and regulatory factors, reinforcing a cautious stance despite long-term expansion plans. The latest developments add a new macroeconomic risk dimension, as future direction now hinges on upcoming U.S. inflation readings and Federal Reserve policy signals.











-
 Afghanistan
-
 Albania
-
 Algeria
-
 Angola
-
 Argentina
-
 Armenia
-
 Australia
-
 Austria
-
 Azerbaijan
-
 Bahamas
-
 Bahrain
-
 Bangladesh
-
 Belarus
-
 Belgium
-
 Bolivia
-
 Botswana
-
 Brazil
-
 Brunei
-
 Bulgaria
-
 Cambodia
-
 Cameroon
-
 Canada
-
 Chile
-
 China
-
 Colombia
-
 Congo
-
 Costa Rica
-
 Cote d'Ivoire
-
 Croatia
-
 Cuba
-
 Cyprus
-
 Czechia
-
 DR Congo
-
 Denmark
-
 Dominican Republic
-
 Ecuador
-
 Egypt
-
 El Salvador
-
 Estonia
-
 Eswatini
-
 Ethiopia
-
 Finland
-
 France
-
 Georgia
-
 Germany
-
 Ghana
-
 Greece
-
 Haiti
-
 Hong Kong
-
 Hungary
-
 India
-
 Indonesia
-
 Iran, Islamic republic
-
 Iraq
-
 Ireland
-
 Israel
-
 Italy
-
 Jamaica
-
 Japan
-
 Jordan
-
 Kazakhstan
-
 Kenya
-
 Korea
-
 Kuwait
-
 Kyrgyzstan
-
 Laos
-
 Latvia
-
 Lebanon
-
 Lesotho
-
 Libya
-
 Lithuania
-
 Luxembourg
-
 Madagascar
-
 Malaysia
-
 Malta
-
 Mauritius
-
 Mexico
-
 Moldova
-
 Mongolia
-
 Montenegro
-
 Morocco
-
 Mozambique
-
 Myanmar
-
 Namibia
-
 Nepal
-
 Netherlands
-
 New Zealand
-
 Nigeria
-
 North Macedonia
-
 Norway
-
 Oman
-
 Pakistan
-
 Palestine
-
 Panama
-
 Papua New Guinea
-
 Paraguay
-
 Peru
-
 Philippines
-
 Poland
-
 Portugal
-
 Puerto Rico
-
 Qatar
-
 Reunion
-
 Romania
-
 Rwanda
-
 Saudi Arabia
-
 Serbia
-
 Singapore
-
 Slovakia
-
 Slovenia
-
 Somalia
-
 South Africa
-
 Spain
-
 Sri Lanka
-
 Sweden
-
 Switzerland
-
 Syria
-
 Taiwan
-
 Tajikistan
-
 Tanzania
-
 Thailand
-
 Trinidad and Tobago
-
 Tunisia
-
 Turkey
-
 UAE
-
 Uganda
-
 Ukraine
-
 United Kingdom
-
United States
-
 Uruguay
-
 Uzbekistan
-
 Venezuela
-
 Vietnam
-
 Yemen
-
 Zambia
-
 Zimbabwe
- Forex
- Crypto












