

Reckitt Benckiser shares drop about 1.5% after sustained downward momentum and oversold signals

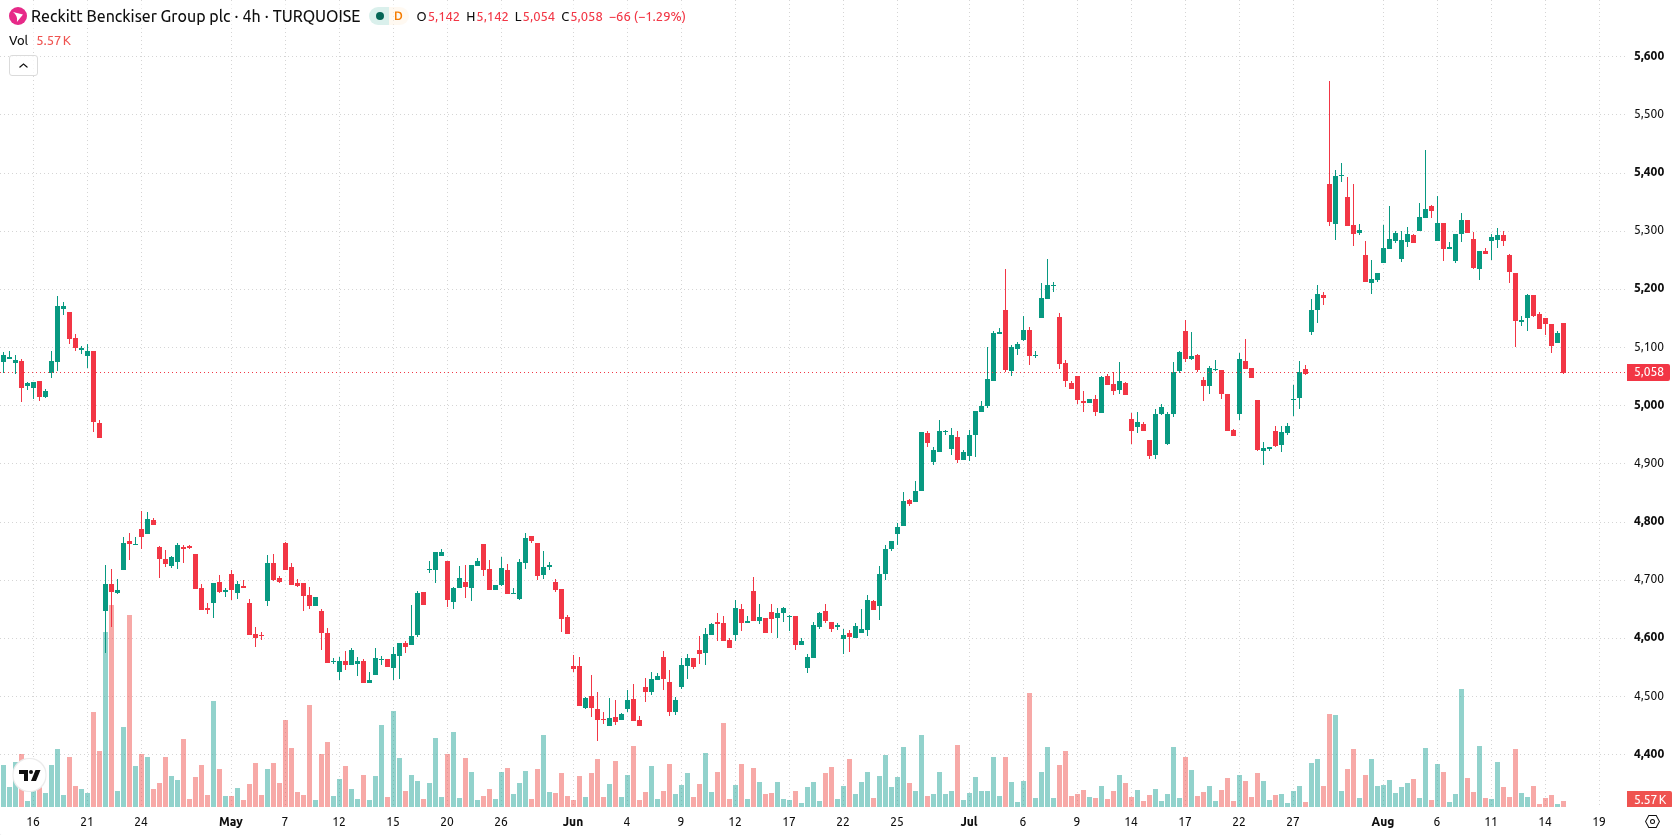
Reckitt Benckiser Group plc (RKT) dropped 1.56% as a wave of early selling pressure and weak technical momentum weighed on the session. The down move is supported by the stock’s position below its 20-day and 200-day moving averages, with a bearish long-term trend limiting any recovery.
 5716.00
5728.00
Highlights
- Shares of Reckitt Benckiser trade below their 20-day and 200-day averages, indicating sustained selling pressure.
- MACD indicates buy momentum, but RSI and Stochastic RSI show oversold conditions and intraday momentum favors sellers.
- Next five days forecast a GBX4,926 to GBX5,154 range, with equal chances for a breakout or further decline.
Oversold readings persist as conflicting technical signals cap recovery
Reckitt Benckiser is trading below its 20-day moving average (GBX5,173) and 200-day moving average (GBX5,480), but remains above the 50-day moving average (GBX4,979). This setup points to ongoing short- and long-term selling pressure, with some medium-term support in place. The bearish alignment between the 50-day and 200-day averages confirms a weaker long-term trend, and immediate resistance is at GBX5,060. Support aligns with the 50-day average at GBX4,979. Momentum readings present a mixed outlook: the MACD indicates strong buy momentum, while the ADX at 18.83 remains neutral. The RSI at 49.07 leans towards a sell prospect, and the Stochastic RSI at zero signals pronounced oversold conditions. The CCI is neutral, and BBP at -41.33 confirms sellers control short-term momentum, reinforcing an oversold market stance. After a GBX80 drop today, price is near the session low with high intraday volatility and persistent early sell pressure.
Earlier, analysts noted that Reckitt Benckiser's technical outlook remained under persistent downside risk, with mixed momentum signals reinforcing a cautious stance. The updated analysis corroborates this view, highlighting continued selling pressure alongside heightened volatility, making a decisive move above or below the GBX5,060–GBX4,979 band a key signal for the next trend direction.











-
 Afghanistan
-
 Albania
-
 Algeria
-
 Angola
-
 Argentina
-
 Armenia
-
 Australia
-
 Austria
-
 Azerbaijan
-
 Bahamas
-
 Bahrain
-
 Bangladesh
-
 Belarus
-
 Belgium
-
 Bolivia
-
 Botswana
-
 Brazil
-
 Brunei
-
 Bulgaria
-
 Cambodia
-
 Cameroon
-
 Canada
-
 Chile
-
 China
-
 Colombia
-
 Congo
-
 Costa Rica
-
 Cote d'Ivoire
-
 Croatia
-
 Cuba
-
 Cyprus
-
 Czechia
-
 DR Congo
-
 Denmark
-
 Dominican Republic
-
 Ecuador
-
 Egypt
-
 El Salvador
-
 Estonia
-
 Eswatini
-
 Ethiopia
-
 Finland
-
 France
-
 Georgia
-
 Germany
-
 Ghana
-
 Greece
-
 Haiti
-
 Hong Kong
-
 Hungary
-
 India
-
 Indonesia
-
 Iran, Islamic republic
-
 Iraq
-
 Ireland
-
 Israel
-
 Italy
-
 Jamaica
-
 Japan
-
 Jordan
-
 Kazakhstan
-
 Kenya
-
 Korea
-
 Kuwait
-
 Kyrgyzstan
-
 Laos
-
 Latvia
-
 Lebanon
-
 Lesotho
-
 Libya
-
 Lithuania
-
 Luxembourg
-
 Madagascar
-
 Malaysia
-
 Malta
-
 Mauritius
-
 Mexico
-
 Moldova
-
 Mongolia
-
 Montenegro
-
 Morocco
-
 Mozambique
-
 Myanmar
-
 Namibia
-
 Nepal
-
 Netherlands
-
 New Zealand
-
 Nigeria
-
 North Macedonia
-
 Norway
-
 Oman
-
 Pakistan
-
 Palestine
-
 Panama
-
 Papua New Guinea
-
 Paraguay
-
 Peru
-
 Philippines
-
 Poland
-
 Portugal
-
 Puerto Rico
-
 Qatar
-
 Reunion
-
 Romania
-
 Rwanda
-
 Saudi Arabia
-
 Serbia
-
 Singapore
-
 Slovakia
-
 Slovenia
-
 Somalia
-
 South Africa
-
 Spain
-
 Sri Lanka
-
 Sweden
-
 Switzerland
-
 Syria
-
 Taiwan
-
 Tajikistan
-
 Tanzania
-
 Thailand
-
 Trinidad and Tobago
-
 Tunisia
-
 Turkey
-
 UAE
-
 Uganda
-
 Ukraine
-
 United Kingdom
-
United States
-
 Uruguay
-
 Uzbekistan
-
 Venezuela
-
 Vietnam
-
 Yemen
-
 Zambia
-
 Zimbabwe
- Forex
- Crypto












