

National Grid shares technical analysis: Failed breakout at GBX1,196 resistance keeps gains in check

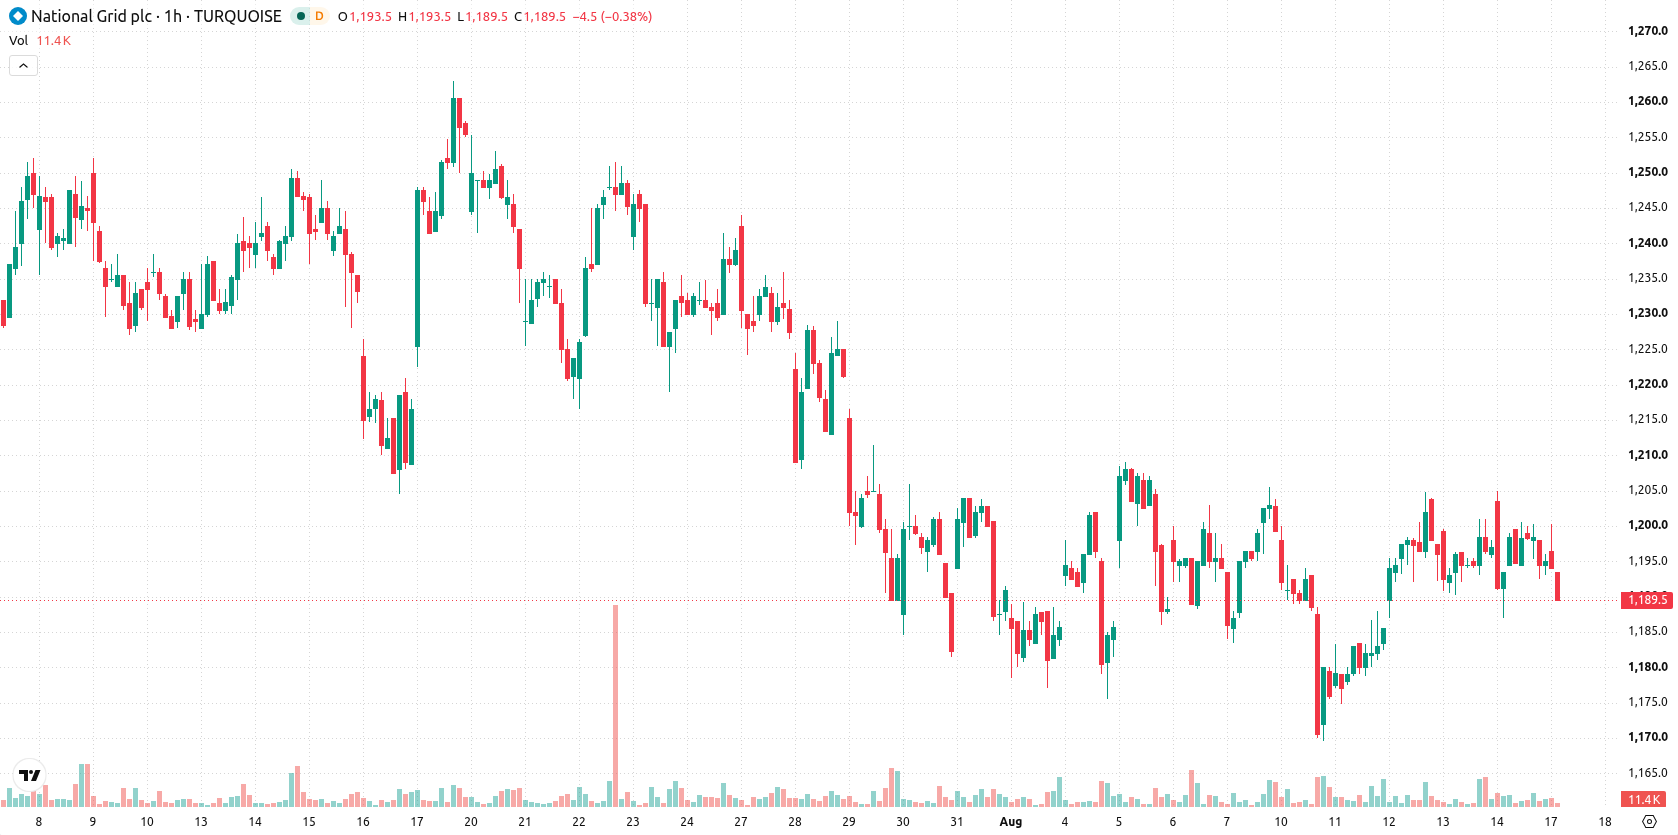
National Grid (NG) stock is trading at GBX1,188 today, showing a modest move in a narrow range during the latest session. The stock is currently positioned below its key moving averages.
 1279.50
Highlights
- Shares of National Grid trade below key moving averages across all timeframes, indicating persistent selling momentum.
- Oscillator signals are mixed, with some pointing to oversold conditions but others showing weak or neutral trend strength.
- Over the next 2 to 3 days, the stock is expected to move between GBX1,174 and GBX1,205, with a 75% probability of a downward move.
Conflicting signals as resistance holds and momentum remains weak
On the hourly chart, the price is holding below the MA-20 and MA-50, while remaining under the MA-200 on the daily timeframe. The Ichimoku Kijun level is set at GBX1,196, which serves as immediate resistance. MACD is presenting a strong buy signal, whereas the ADX reading is neutral, suggesting a lack of defined trend strength. The RSI stands at 44.57, reflecting a selling signal. Both Stochastic RSI and CCI indicate oversold conditions, suggesting downside exhaustion, even as Bull/Bear Power highlights intraday dominance by sellers. The Awesome Oscillator remains neutral, providing no confirmation for a move in either direction.
Sideways bias as volatility bands contain breakout risks
Looking ahead, the expected trading range for the next two to three sessions is forecast between GBX1,174 and GBX1,205, reflecting the typical volatility band relative to current levels. The baseline scenario calls for price action to remain largely sideways within this band. There is a 25% probability of a break to the upside above GBX1,196 resistance, which could fuel further gains, while a failure to hold the lower bound near GBX1,174 may set the stage for a more decisive decline.
Earlier, analysts noted that National Grid shares were consolidating within a defined range as investors watched for signals on project execution and regulatory discipline. The current technical setup reaffirms this consolidative behavior, with attention now turning to whether the price can establish a firmer direction upon testing the GBX1,196 resistance or the GBX1,174 support in the coming sessions.






Latest National Grid News





-
 Afghanistan
-
 Albania
-
 Algeria
-
 Angola
-
 Argentina
-
 Armenia
-
 Australia
-
 Austria
-
 Azerbaijan
-
 Bahamas
-
 Bahrain
-
 Bangladesh
-
 Belarus
-
 Belgium
-
 Bolivia
-
 Botswana
-
 Brazil
-
 Brunei
-
 Bulgaria
-
 Cambodia
-
 Cameroon
-
 Canada
-
 Chile
-
 China
-
 Colombia
-
 Congo
-
 Costa Rica
-
 Cote d'Ivoire
-
 Croatia
-
 Cuba
-
 Cyprus
-
 Czechia
-
 DR Congo
-
 Denmark
-
 Dominican Republic
-
 Ecuador
-
 Egypt
-
 El Salvador
-
 Estonia
-
 Eswatini
-
 Ethiopia
-
 Finland
-
 France
-
 Georgia
-
 Germany
-
 Ghana
-
 Greece
-
 Haiti
-
 Hong Kong
-
 Hungary
-
 India
-
 Indonesia
-
 Iran, Islamic republic
-
 Iraq
-
 Ireland
-
 Israel
-
 Italy
-
 Jamaica
-
 Japan
-
 Jordan
-
 Kazakhstan
-
 Kenya
-
 Korea
-
 Kuwait
-
 Kyrgyzstan
-
 Laos
-
 Latvia
-
 Lebanon
-
 Lesotho
-
 Libya
-
 Lithuania
-
 Luxembourg
-
 Madagascar
-
 Malaysia
-
 Malta
-
 Mauritius
-
 Mexico
-
 Moldova
-
 Mongolia
-
 Montenegro
-
 Morocco
-
 Mozambique
-
 Myanmar
-
 Namibia
-
 Nepal
-
 Netherlands
-
 New Zealand
-
 Nigeria
-
 North Macedonia
-
 Norway
-
 Oman
-
 Pakistan
-
 Palestine
-
 Panama
-
 Papua New Guinea
-
 Paraguay
-
 Peru
-
 Philippines
-
 Poland
-
 Portugal
-
 Puerto Rico
-
 Qatar
-
 Reunion
-
 Romania
-
 Rwanda
-
 Saudi Arabia
-
 Serbia
-
 Singapore
-
 Slovakia
-
 Slovenia
-
 Somalia
-
 South Africa
-
 Spain
-
 Sri Lanka
-
 Sweden
-
 Switzerland
-
 Syria
-
 Taiwan
-
 Tajikistan
-
 Tanzania
-
 Thailand
-
 Trinidad and Tobago
-
 Tunisia
-
 Turkey
-
 UAE
-
 Uganda
-
 Ukraine
-
 United Kingdom
-
United States
-
 Uruguay
-
 Uzbekistan
-
 Venezuela
-
 Vietnam
-
 Yemen
-
 Zambia
-
 Zimbabwe
- Forex
- Crypto












