

Home Depot stock stalls below resistance at $337.57 as mixed momentum signals persist: weekly analysis

Shares of Home Depot, Inc. (HD) are trading near $335 with sellers keeping pressure as the setup remains deep in oversold territory. The daily chart highlights mixed momentum signals that limit conviction for either buyers or sellers in the week ahead. Watch for technical barriers and any fundamental catalysts to inform the next move.
 341.51
330.46
Highlights
- Shares of Home Depot fell to $335.22 and remain below key moving averages, confirming a bearish long-term trend.
- Technical indicators are mixed with MACD showing a strong buy signal but momentum measures registering both neutral and oversold conditions.
- The five-day base case is consolidation between $322.84 and $337.57, with a potential range of $322.84 to $344.51.
Earnings anticipation and leadership change shape flows and sentiment
Home Depot is set to report its fiscal second-quarter earnings on August 18, 2026, with attention on comparable sales and pro contractor demand amid a weak housing market, as featured by Yahoo Finance and Trefis. In the latest quarter, the Bill & Melinda Gates Foundation Trust opened a $353 million position in HD, and Exchange Traded Concepts LLC also increased its stake by 36.3%, according to Yahoo Finance and MarketBeat. CEO Ted Decker announced a medical leave on August 12, 2026, but management signaled operational stability and expects his return within months.
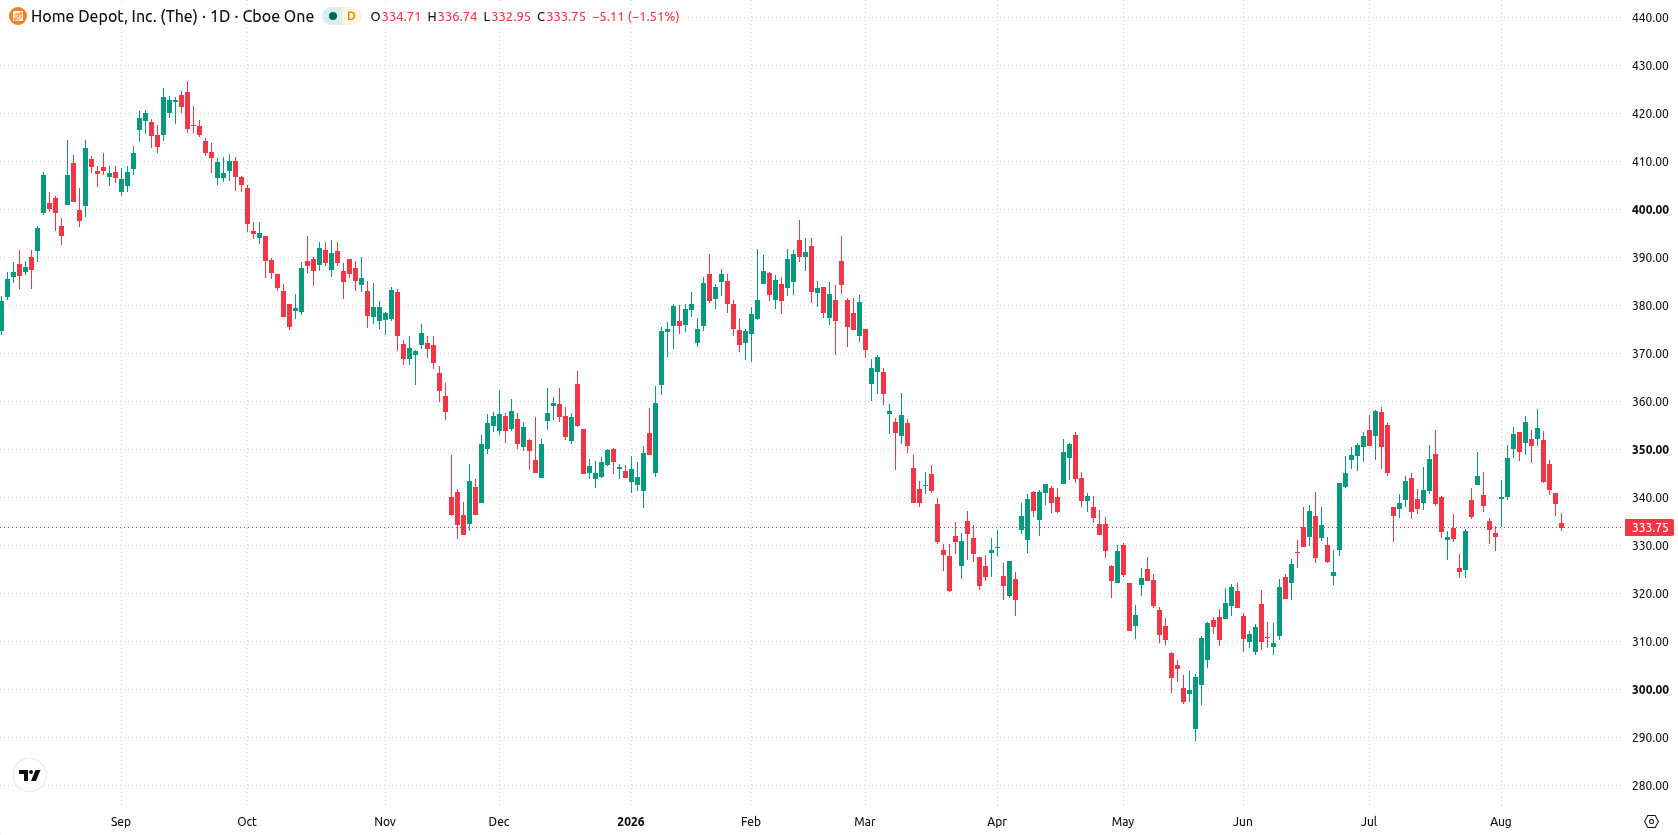
Narrow weekly range as mixed momentum and resistance cap moves
On the daily chart, price action sits at the bottom of last week’s range amid a contained move within a narrow range, as volatility reached 6.16%. The MACD signal remains oriented to "Strong Buy," but daily momentum is mixed, with Stochastic RSI registering an oversold reading at 3.95 while the RSI holds at a neutral 47.58. Immediate resistance is at $337.57, just above current levels, reinforced by the Ichimoku Kijun at $340.71, which may limit any rebound in the short term.
Consolidation likely as breakout risks frame next week’s range
For the next five trading days, the expected range is $322.84 to $344.51, with a balanced 50% probability of either an increase or a decrease from current levels. The base case is for consolidation between $322.84 and $337.57. A break above $337.57 opens potential for a move toward $344.51, while a drop below $322.84 would mark further weakness.
Earlier, analysts noted that Home Depot stock was in a range-bound pattern, with no clear directional bias amid mixed momentum signals. With price action now testing key support levels and volatility remaining contained, traders should watch for a decisive move above $337.57 or below $322.84 to indicate the next trend direction.






Latest Home Depot News



-
 Afghanistan
-
 Albania
-
 Algeria
-
 Angola
-
 Argentina
-
 Armenia
-
 Australia
-
 Austria
-
 Azerbaijan
-
 Bahamas
-
 Bahrain
-
 Bangladesh
-
 Belarus
-
 Belgium
-
 Bolivia
-
 Botswana
-
 Brazil
-
 Brunei
-
 Bulgaria
-
 Cambodia
-
 Cameroon
-
 Canada
-
 Chile
-
 China
-
 Colombia
-
 Congo
-
 Costa Rica
-
 Cote d'Ivoire
-
 Croatia
-
 Cuba
-
 Cyprus
-
 Czechia
-
 DR Congo
-
 Denmark
-
 Dominican Republic
-
 Ecuador
-
 Egypt
-
 El Salvador
-
 Estonia
-
 Eswatini
-
 Ethiopia
-
 Finland
-
 France
-
 Georgia
-
 Germany
-
 Ghana
-
 Greece
-
 Haiti
-
 Hong Kong
-
 Hungary
-
 India
-
 Indonesia
-
 Iran, Islamic republic
-
 Iraq
-
 Ireland
-
 Israel
-
 Italy
-
 Jamaica
-
 Japan
-
 Jordan
-
 Kazakhstan
-
 Kenya
-
 Korea
-
 Kuwait
-
 Kyrgyzstan
-
 Laos
-
 Latvia
-
 Lebanon
-
 Lesotho
-
 Libya
-
 Lithuania
-
 Luxembourg
-
 Madagascar
-
 Malaysia
-
 Malta
-
 Mauritius
-
 Mexico
-
 Moldova
-
 Mongolia
-
 Montenegro
-
 Morocco
-
 Mozambique
-
 Myanmar
-
 Namibia
-
 Nepal
-
 Netherlands
-
 New Zealand
-
 Nigeria
-
 North Macedonia
-
 Norway
-
 Oman
-
 Pakistan
-
 Palestine
-
 Panama
-
 Papua New Guinea
-
 Paraguay
-
 Peru
-
 Philippines
-
 Poland
-
 Portugal
-
 Puerto Rico
-
 Qatar
-
 Reunion
-
 Romania
-
 Rwanda
-
 Saudi Arabia
-
 Serbia
-
 Singapore
-
 Slovakia
-
 Slovenia
-
 Somalia
-
 South Africa
-
 Spain
-
 Sri Lanka
-
 Sweden
-
 Switzerland
-
 Syria
-
 Taiwan
-
 Tajikistan
-
 Tanzania
-
 Thailand
-
 Trinidad and Tobago
-
 Tunisia
-
 Turkey
-
 UAE
-
 Uganda
-
 Ukraine
-
 United Kingdom
-
United States
-
 Uruguay
-
 Uzbekistan
-
 Venezuela
-
 Vietnam
-
 Yemen
-
 Zambia
-
 Zimbabwe
- Forex
- Crypto












