


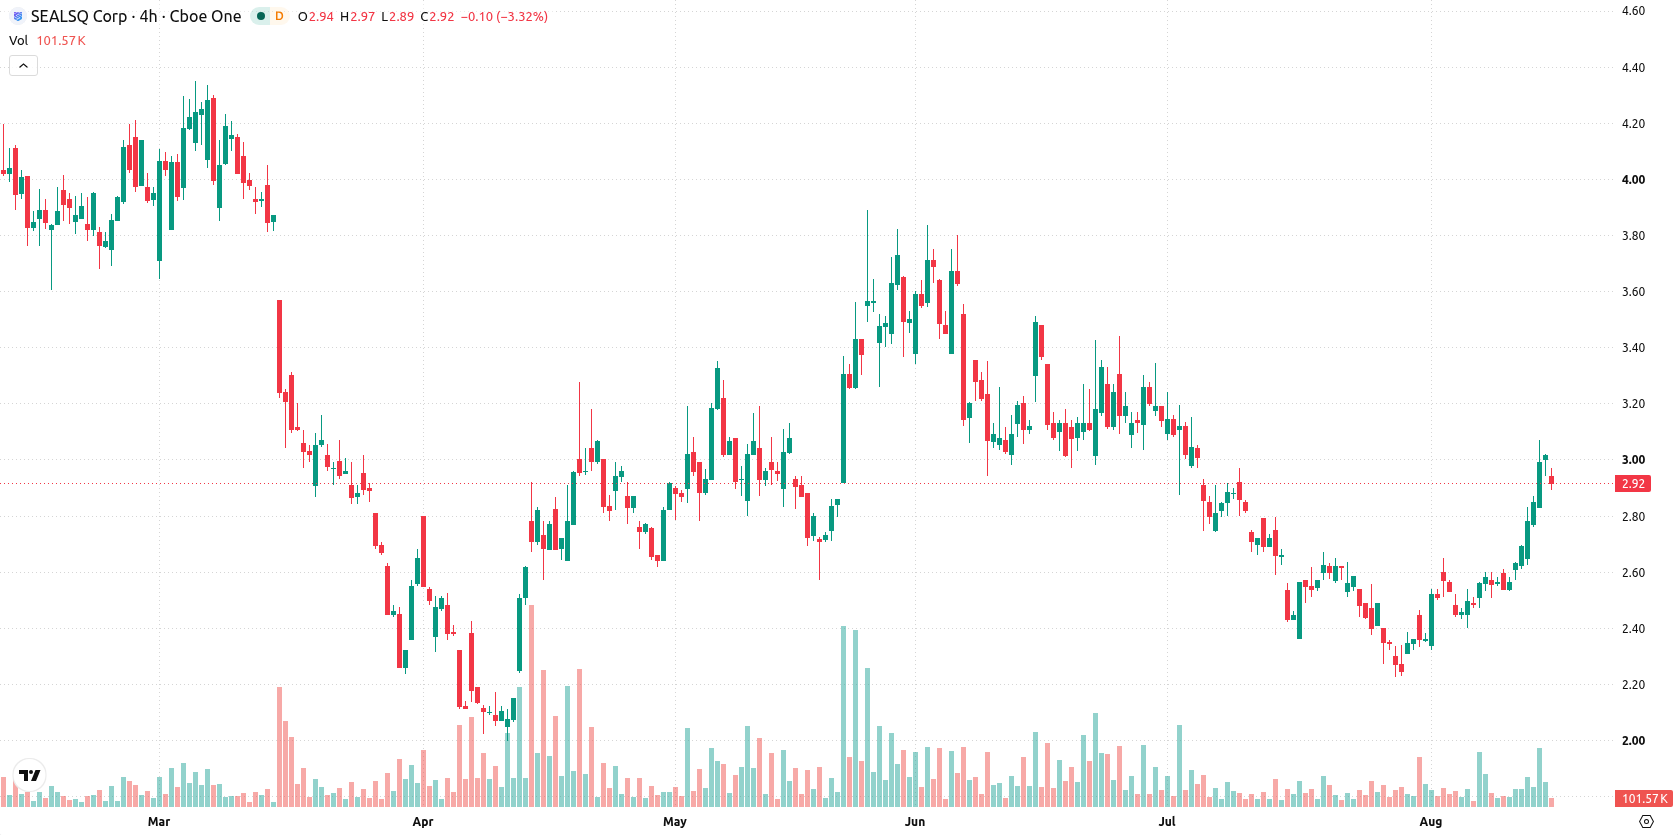
SEALSQ Corp (LAES) fell 3.49% as sellers pressured the stock throughout the session, with intraday volatility heightened after an early downside gap. The decline looks limited for now, as SEALSQ continues to trade above both its 20-day and 50-day moving averages but remains stuck below the longer-term 200-day average.
 1.98
2.37
1.98
2.37
Highlights
- Shares of SEALSQ last traded at $2.91, down 3.49% after a downside gap of 2.33%, remaining near the session low.
- Short-term momentum indicators are overbought while trend indicators remain neutral, pointing to mixed technical signals.
- SEALSQ stock is expected to trade between $2.65 and $3.18 over the next five days, with the baseline scenario favoring sideways movement around current levels.
Bullish momentum in short term contrasted by overbought signals
SEALSQ is trading above its 20-day and 50-day moving averages, set at $2.54 and $2.83 respectively, indicating near-term and intermediate-term strength. However, the price remains below the 200-day moving average of $3.62, signaling ongoing bearishness in the broader trend. Immediate support is located at $2.90, with resistance at $2.97. Momentum indicators deliver mixed messages: MACD and ADX are neutral, but the RSI at 65.49 and CCI at 262.09 indicate overbought conditions, and Stochastic RSI is fully overbought at 100. The Bull/Bear Power at 0.42 confirms buying strength intraday, and the Awesome Oscillator highlights a strong buy signal. The recent drop brought the price to $2.91, with the session near its low and volatility measured at 2.41%. Intraday selling contrasts with otherwise bullish momentum indicators.
Earlier, analysts noted that SEALSQ was exhibiting bullish technical momentum with support from positive sector trends. The current analysis adds complexity by highlighting overbought signals and increased intraday volatility, suggesting traders should closely monitor the $2.90 support for signs of a potential downside risk.










-
 Afghanistan
-
 Albania
-
 Algeria
-
 Angola
-
 Argentina
-
 Armenia
-
 Australia
-
 Austria
-
 Azerbaijan
-
 Bahamas
-
 Bahrain
-
 Bangladesh
-
 Belarus
-
 Belgium
-
 Bolivia
-
 Botswana
-
 Brazil
-
 Brunei
-
 Bulgaria
-
 Cambodia
-
 Cameroon
-
 Canada
-
 Chile
Chile
-
 China
China
-
 Colombia
-
 Congo
Congo
-
 Costa Rica
-
 Cote d'Ivoire
-
 Croatia
-
 Cuba
Cuba
-
 Cyprus
-
 Czechia
-
 DR Congo
-
 Denmark
-
 Dominican Republic
-
 Ecuador
-
 Egypt
Egypt
-
 El Salvador
-
 Estonia
-
 Eswatini
-
 Ethiopia
-
 Finland
-
 France
-
 Georgia
-
 Germany
-
 Ghana
Ghana
-
 Greece
-
 Haiti
Haiti
-
 Hong Kong
-
 Hungary
-
 India
India
-
 Indonesia
-
 Iran, Islamic republic
-
 Iraq
Iraq
-
 Ireland
-
 Israel
-
 Italy
Italy
-
 Jamaica
-
 Japan
Japan
-
 Jordan
-
 Kazakhstan
-
 Kenya
Kenya
-
 Korea
Korea
-
 Kuwait
-
 Kyrgyzstan
-
 Laos
Laos
-
 Latvia
-
 Lebanon
-
 Lesotho
-
 Libya
Libya
-
 Lithuania
-
 Luxembourg
-
 Madagascar
-
 Malaysia
-
 Malta
Malta
-
 Mauritius
-
 Mexico
-
 Moldova
-
 Mongolia
-
 Montenegro
-
 Morocco
-
 Mozambique
-
 Myanmar
-
 Namibia
-
 Nepal
Nepal
-
 Netherlands
-
 New Zealand
-
 Nigeria
-
 North Macedonia
-
 Norway
-
 Oman
Oman
-
 Pakistan
-
 Palestine
-
 Panama
-
 Papua New Guinea
-
 Paraguay
-
 Peru
Peru
-
 Philippines
-
 Poland
-
 Portugal
-
 Puerto Rico
-
 Qatar
Qatar
-
 Reunion
-
 Romania
-
 Rwanda
-
 Saudi Arabia
-
 Serbia
-
 Singapore
-
 Slovakia
-
 Slovenia
-
 Somalia
-
 South Africa
-
 Spain
Spain
-
 Sri Lanka
-
 Sweden
-
 Switzerland
-
 Syria
Syria
-
 Taiwan
-
 Tajikistan
-
 Tanzania
-
 Thailand
-
 Trinidad and Tobago
-
 Tunisia
-
 Turkey
-
 UAE
UAE
-
 Uganda
-
 Ukraine
-
 United Kingdom
-
United States
-
 Uruguay
-
 Uzbekistan
-
 Venezuela
-
 Vietnam
-
 Yemen
Yemen
-
 Zambia
-
 Zimbabwe
- Forex
- Crypto












