

Gartner shares fall over 3% as technical signals highlight short-term momentum cooling

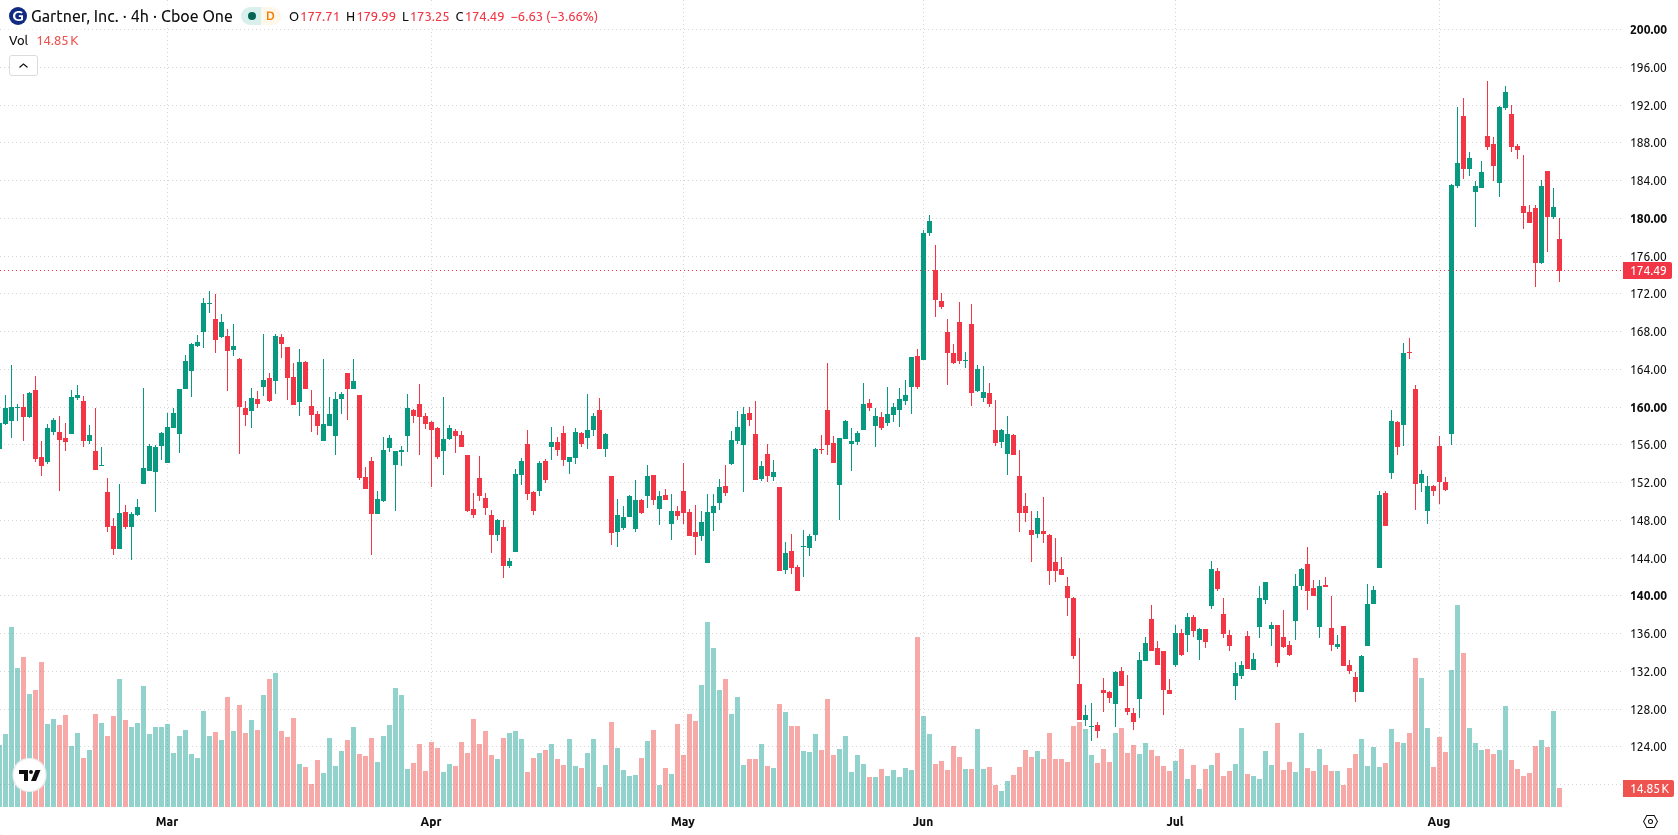
Gartner Inc (IT) fell 3.14% as technical signals flagged a cooling in short-term momentum despite prevailing strength. The move looks limited, with price action supported by short- and medium-term moving averages but still capped below the longer-term trend ceiling.
 231.21
234.48
Highlights
- Shares of Gartner trade above short- and medium-term moving averages but remain below the longer-term trend level.
- Indicators show momentum and buying pressure are strong, yet the latest session saw shares drop 3.14% to $175.4 with early weakness.
- In the next five days, expect a price range of $166.1 to $186.08, with 71% probability of an upward move if resistance at $178.57 breaks.
Bullish momentum dominates as long-term ceiling limits advances
Gartner is trading above both the 20-day and 50-day moving averages, at $163.67 and $149.3 respectively, but remains below the 200-day moving average at $180.88. This setup confirms ongoing strength in the short- and medium-term, though the longer-term trend is hindered by a bearish alignment between the 50-day and 200-day averages. Immediate levels to watch are resistance at the near-term ceiling of $178.57 and support at the near-term floor of $173.42. Momentum remains strong with the MACD and ADX both signaling a buy. The RSI sits at 61.71, remaining in bullish territory but shy of overbought extremes. The CCI is also positive, reinforcing upward pressure, while the Stochastic RSI is neutral and the Awesome Oscillator appears sideways. Bull/Bear Power (BBP) at 9.06 indicates buyers dominate intraday momentum, and its overbought forecast signals the stock may be extended on the upside. Gartner is currently at $175.4 after a daily drop of $5.69, down 3.14%. The session opened with a downside gap of about $2.67, or 1.47%, and volatility amplitude stands at 2.97%. The price is mid-range for the day, reflecting early pressure after the open even as overall momentum signals remain supportive.
Earlier, analysts noted that despite Gartner's bullish earnings and buybacks, short-term technical signals indicated heightened caution and the potential for further volatility. The latest price action affirms this dynamic, as momentum remains supportive but traders should focus on the $178.57 resistance and $173.42 support as the next inflection points for a breakout or breakdown within the current consolidation range.






Latest Gartner Inc News





-
 Afghanistan
-
 Albania
-
 Algeria
-
 Angola
-
 Argentina
-
 Armenia
-
 Australia
-
 Austria
-
 Azerbaijan
-
 Bahamas
-
 Bahrain
-
 Bangladesh
-
 Belarus
-
 Belgium
-
 Bolivia
-
 Botswana
-
 Brazil
-
 Brunei
-
 Bulgaria
-
 Cambodia
-
 Cameroon
-
 Canada
-
 Chile
-
 China
-
 Colombia
-
 Congo
-
 Costa Rica
-
 Cote d'Ivoire
-
 Croatia
-
 Cuba
-
 Cyprus
-
 Czechia
-
 DR Congo
-
 Denmark
-
 Dominican Republic
-
 Ecuador
-
 Egypt
-
 El Salvador
-
 Estonia
-
 Eswatini
-
 Ethiopia
-
 Finland
-
 France
-
 Georgia
-
 Germany
-
 Ghana
-
 Greece
-
 Haiti
-
 Hong Kong
-
 Hungary
-
 India
-
 Indonesia
-
 Iran, Islamic republic
-
 Iraq
-
 Ireland
-
 Israel
-
 Italy
-
 Jamaica
-
 Japan
-
 Jordan
-
 Kazakhstan
-
 Kenya
-
 Korea
-
 Kuwait
-
 Kyrgyzstan
-
 Laos
-
 Latvia
-
 Lebanon
-
 Lesotho
-
 Libya
-
 Lithuania
-
 Luxembourg
-
 Madagascar
-
 Malaysia
-
 Malta
-
 Mauritius
-
 Mexico
-
 Moldova
-
 Mongolia
-
 Montenegro
-
 Morocco
-
 Mozambique
-
 Myanmar
-
 Namibia
-
 Nepal
-
 Netherlands
-
 New Zealand
-
 Nigeria
-
 North Macedonia
-
 Norway
-
 Oman
-
 Pakistan
-
 Palestine
-
 Panama
-
 Papua New Guinea
-
 Paraguay
-
 Peru
-
 Philippines
-
 Poland
-
 Portugal
-
 Puerto Rico
-
 Qatar
-
 Reunion
-
 Romania
-
 Rwanda
-
 Saudi Arabia
-
 Serbia
-
 Singapore
-
 Slovakia
-
 Slovenia
-
 Somalia
-
 South Africa
-
 Spain
-
 Sri Lanka
-
 Sweden
-
 Switzerland
-
 Syria
-
 Taiwan
-
 Tajikistan
-
 Tanzania
-
 Thailand
-
 Trinidad and Tobago
-
 Tunisia
-
 Turkey
-
 UAE
-
 Uganda
-
 Ukraine
-
 United Kingdom
-
United States
-
 Uruguay
-
 Uzbekistan
-
 Venezuela
-
 Vietnam
-
 Yemen
-
 Zambia
-
 Zimbabwe
- Forex
- Crypto












