

National Grid stock forecast: Resistance test at GBX1,194 amid weak momentum

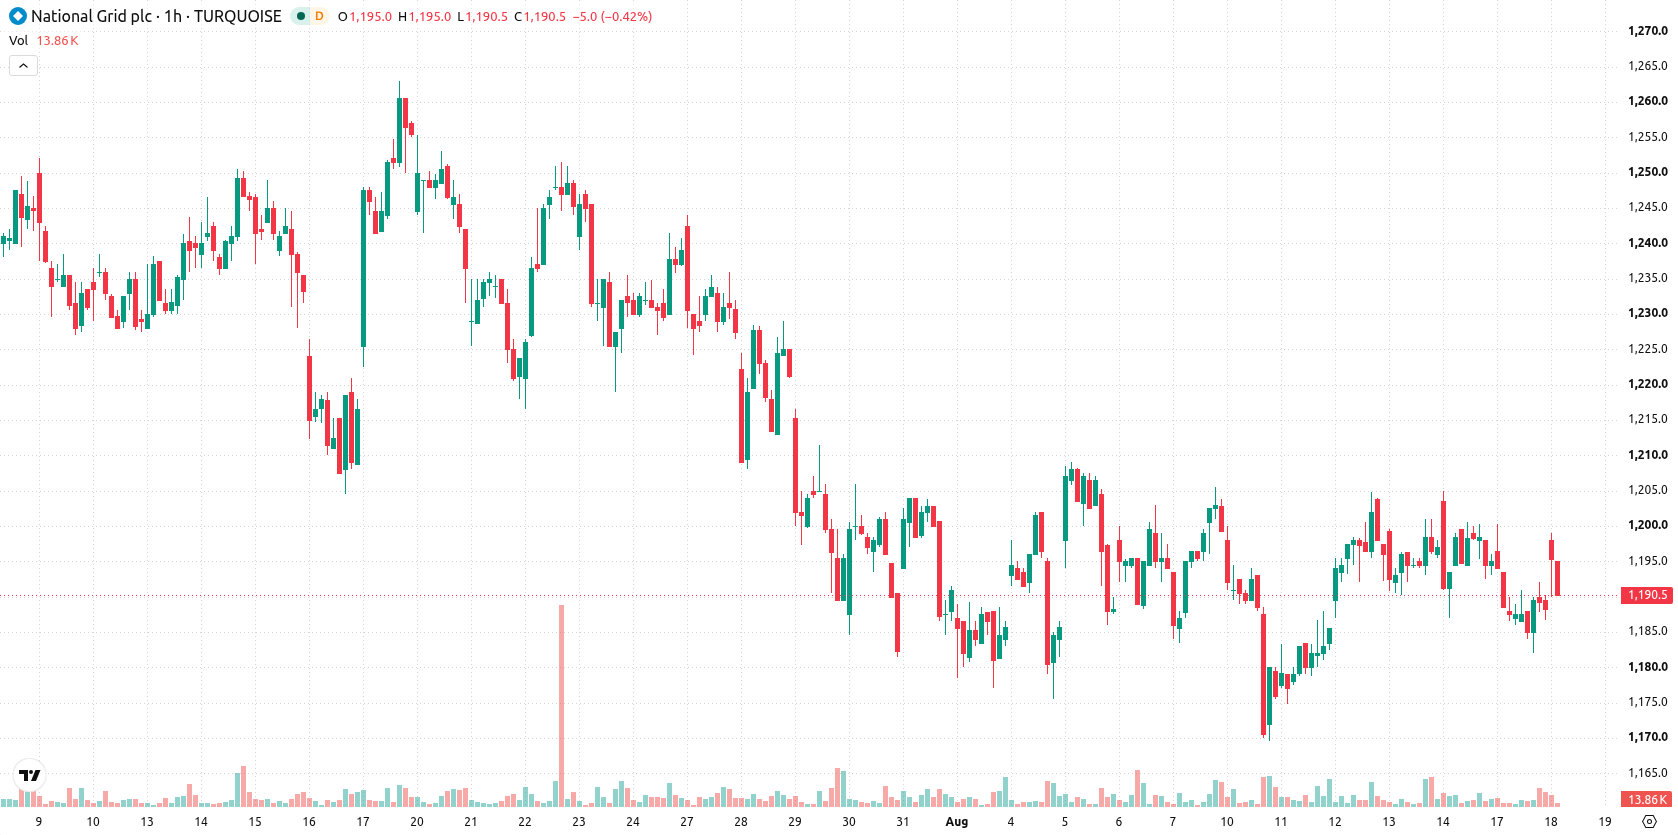
National Grid (NG) stock is trading at GBX1,190, registering a modest rise in today's session. The stock remains below its key moving averages, reflecting persistent short-term and long-term downward pressure.
 1279.50
Highlights
- NG/GBX trades below key moving averages across all timeframes, showing sustained downward pressure and weak trend strength.
- Divergence among technical indicators signals intraday indecision, with MACD pointing to selling momentum and oscillators split between buy and neutral signals.
- Price is expected to stay in a GBX1,180 to GBX1,201 range, with a 79% probability of downside and key resistance near GBX1,194.
Mixed momentum as technicals point to indecision near lows
NG is trading below its MA-20, MA-50, and the long-term MA-200 on the hourly timeframe. The Ichimoku Kijun line stands as immediate resistance at GBX1,194. MACD signals strong selling momentum, while ADX is neutral and does not confirm a strong trend. RSI is giving a Buy signal; in contrast, Stochastic RSI and CCI are neutral, and Bull/Bear Power suggests overbought conditions with buyers in control. The Awesome Oscillator reads neutral, emphasizing a lack of clear commitment from either side and highlighting intraday indecision, especially with price action near today's low and limited volatility.
Downside scenario favored as breakout risk keeps range intact
In the near term, NG is likely to trade within the GBX1,180 to GBX1,201 range, representing the typical volatility band relative to current levels. The probability assessment favors downside moves (79%), though a sustained break above GBX1,194 would be required for a bullish scenario. Conversely, any drop below the prevailing support zone could trigger a bearish reaction. The baseline scenario points to continued sideways activity unless a decisive breakout occurs.
Earlier, analysts noted that National Grid shares were consolidating as investors awaited clearer signals on market direction. The latest data reinforces this consolidative outlook, with traders advised to monitor the GBX1,194 resistance for any shift toward a breakout scenario.






Latest National Grid News





-
 Afghanistan
-
 Albania
-
 Algeria
-
 Angola
-
 Argentina
-
 Armenia
-
 Australia
-
 Austria
-
 Azerbaijan
-
 Bahamas
-
 Bahrain
-
 Bangladesh
-
 Belarus
-
 Belgium
-
 Bolivia
-
 Botswana
-
 Brazil
-
 Brunei
-
 Bulgaria
-
 Cambodia
-
 Cameroon
-
 Canada
-
 Chile
-
 China
-
 Colombia
-
 Congo
-
 Costa Rica
-
 Cote d'Ivoire
-
 Croatia
-
 Cuba
-
 Cyprus
-
 Czechia
-
 DR Congo
-
 Denmark
-
 Dominican Republic
-
 Ecuador
-
 Egypt
-
 El Salvador
-
 Estonia
-
 Eswatini
-
 Ethiopia
-
 Finland
-
 France
-
 Georgia
-
 Germany
-
 Ghana
-
 Greece
-
 Haiti
-
 Hong Kong
-
 Hungary
-
 India
-
 Indonesia
-
 Iran, Islamic republic
-
 Iraq
-
 Ireland
-
 Israel
-
 Italy
-
 Jamaica
-
 Japan
-
 Jordan
-
 Kazakhstan
-
 Kenya
-
 Korea
-
 Kuwait
-
 Kyrgyzstan
-
 Laos
-
 Latvia
-
 Lebanon
-
 Lesotho
-
 Libya
-
 Lithuania
-
 Luxembourg
-
 Madagascar
-
 Malaysia
-
 Malta
-
 Mauritius
-
 Mexico
-
 Moldova
-
 Mongolia
-
 Montenegro
-
 Morocco
-
 Mozambique
-
 Myanmar
-
 Namibia
-
 Nepal
-
 Netherlands
-
 New Zealand
-
 Nigeria
-
 North Macedonia
-
 Norway
-
 Oman
-
 Pakistan
-
 Palestine
-
 Panama
-
 Papua New Guinea
-
 Paraguay
-
 Peru
-
 Philippines
-
 Poland
-
 Portugal
-
 Puerto Rico
-
 Qatar
-
 Reunion
-
 Romania
-
 Rwanda
-
 Saudi Arabia
-
 Serbia
-
 Singapore
-
 Slovakia
-
 Slovenia
-
 Somalia
-
 South Africa
-
 Spain
-
 Sri Lanka
-
 Sweden
-
 Switzerland
-
 Syria
-
 Taiwan
-
 Tajikistan
-
 Tanzania
-
 Thailand
-
 Trinidad and Tobago
-
 Tunisia
-
 Turkey
-
 UAE
-
 Uganda
-
 Ukraine
-
 United Kingdom
-
United States
-
 Uruguay
-
 Uzbekistan
-
 Venezuela
-
 Vietnam
-
 Yemen
-
 Zambia
-
 Zimbabwe
- Forex
- Crypto












