

Will ServiceNow stock break $123.67 resistance as Armis acquisition expands AI cyber defense?

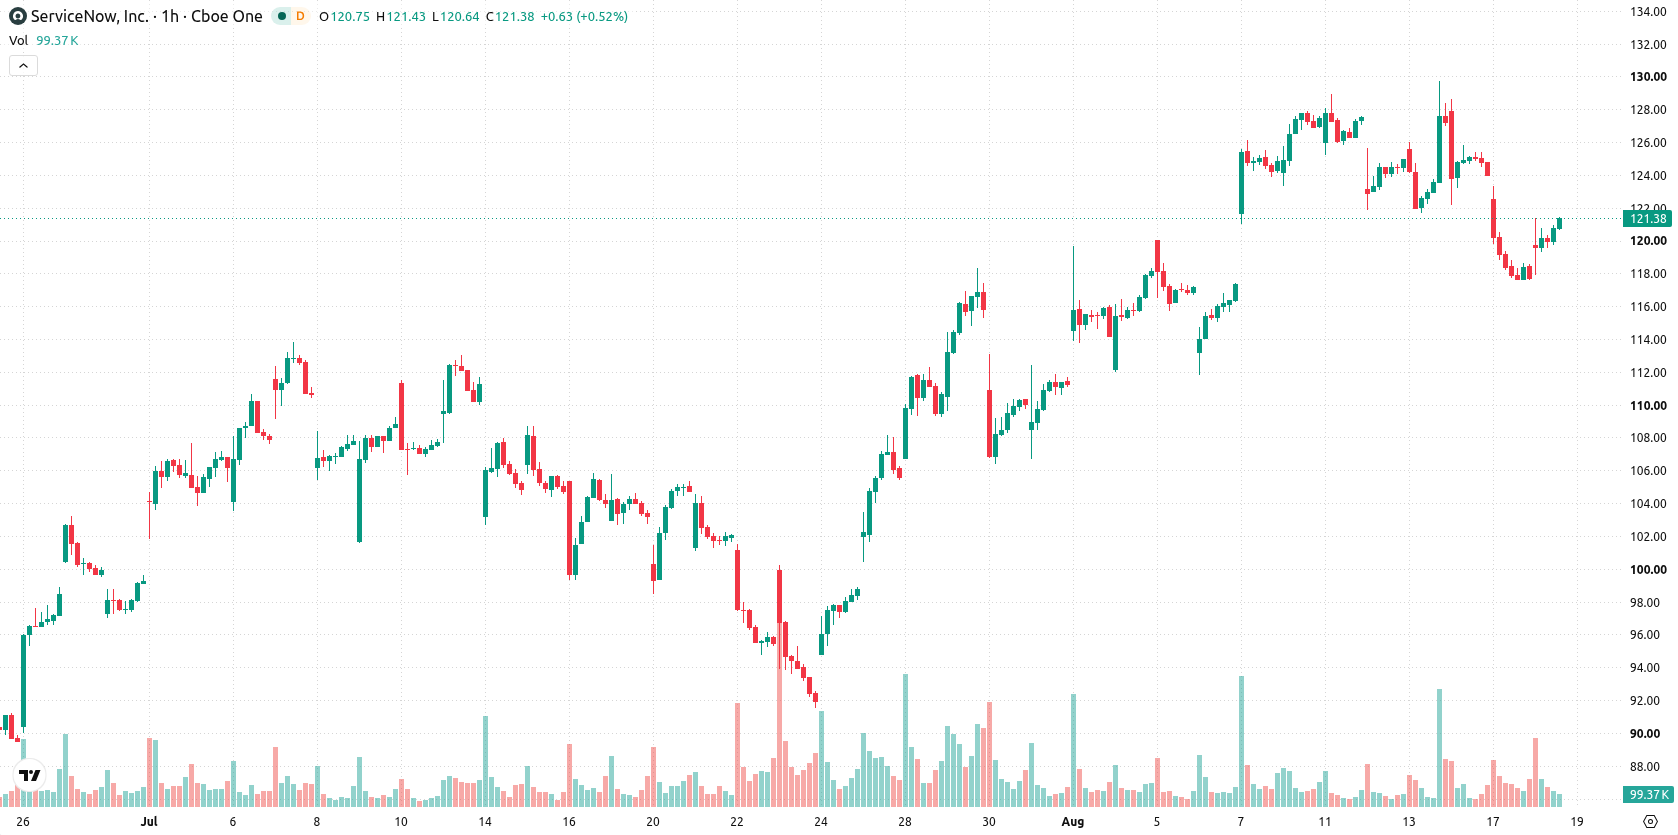
ServiceNow (NOW) stock is trading at $121.57 after rising 3.29% on the day, sitting near the session’s high. The price remains below its key moving averages in the short- and medium-term, but holds just above a major long-term average.
 148.14
142.38
148.14
142.38
Highlights
- ServiceNow will acquire Armis for $7.75 billion in cash to enhance its AI-powered cybersecurity portfolio for enterprise clients.
- Q2 FY2026 subscription revenue at ServiceNow rose 24.5% year over year to $3.88 billion, with full-year revenue guidance increased and non-GAAP operating margin projected at 31.5%.
- ServiceNow stock trades below key short- and medium-term moving averages, with a price range of $116.13 to $127.01 expected over the next several days.
Armis acquisition and robust earnings drive institutional inflows
ServiceNow has agreed to acquire cybersecurity firm Armis for $7.75 billion in cash, a move that immediately advances its AI-driven security offerings and strengthens its position in autonomous cyber defense for enterprise clients, according to Finance Yahoo. The deal coincides with ServiceNow's Q2 FY2026 results, as reported by Barchart, which showed a 24.5% year-over-year increase in subscription revenue to $3.88 billion, alongside an upward revision to its full-year revenue guidance and a projected 31.5% non-GAAP operating margin. Recent institutional purchases, noted by MarketBeat, suggest increasing capital allocation toward the stock, reinforcing demand amid the company’s operational momentum.
Mixed momentum and technical boundaries cloud directional bias
NOW trades below both the MA-20 and MA-50 on the H1 timeframe and is positioned just above the MA-200 on the daily chart, highlighting an area of long-term technical support. The Ichimoku Kijun at $123.67 sets immediate resistance, while the MA-200 underpins support on the higher timeframe. Momentum readings are mixed: MACD signals Strong Sell, ADX is Neutral, and RSI stands at 46.53 (Sell). Stoch RSI and CCI are Neutral, Bull/Bear Power indicates intraday buyer dominance, and the Awesome Oscillator remains Neutral, reflecting a lack of clear directional confirmation from trend indicators.
Breakout risk balanced as NOW trades near key volatility band
In the short term, NOW is expected to consolidate within a typical volatility band ranging from $116.13 to $127.01. The probability of an upside or downside breakout is balanced at 50% each, suggesting no immediate directional edge. A sustained move above the $123.67 resistance would open a bullish scenario, while a drop below $121.46 would shift focus to support near the lower band.
Earlier, analysts noted that ServiceNow faced persistent downside risk despite ongoing operational growth and expansion into AI and cybersecurity. The latest combination of a major cybersecurity acquisition and stronger-than-expected subscription revenue growth adds a new dimension, making the $123.67 resistance a critical threshold for confirming renewed upward momentum in the near term.





Latest ServiceNow News




-
 Afghanistan
-
 Albania
-
 Algeria
-
 Angola
-
 Argentina
-
 Armenia
-
 Australia
-
 Austria
-
 Azerbaijan
-
 Bahamas
-
 Bahrain
-
 Bangladesh
-
 Belarus
-
 Belgium
-
 Bolivia
-
 Botswana
-
 Brazil
-
 Brunei
-
 Bulgaria
-
 Cambodia
-
 Cameroon
-
 Canada
-
 Chile
Chile
-
 China
China
-
 Colombia
-
 Congo
Congo
-
 Costa Rica
-
 Cote d'Ivoire
-
 Croatia
-
 Cuba
Cuba
-
 Cyprus
-
 Czechia
-
 DR Congo
-
 Denmark
-
 Dominican Republic
-
 Ecuador
-
 Egypt
Egypt
-
 El Salvador
-
 Estonia
-
 Eswatini
-
 Ethiopia
-
 Finland
-
 France
-
 Georgia
-
 Germany
-
 Ghana
Ghana
-
 Greece
-
 Haiti
Haiti
-
 Hong Kong
-
 Hungary
-
 India
India
-
 Indonesia
-
 Iran, Islamic republic
-
 Iraq
Iraq
-
 Ireland
-
 Israel
-
 Italy
Italy
-
 Jamaica
-
 Japan
Japan
-
 Jordan
-
 Kazakhstan
-
 Kenya
Kenya
-
 Korea
Korea
-
 Kuwait
-
 Kyrgyzstan
-
 Laos
Laos
-
 Latvia
-
 Lebanon
-
 Lesotho
-
 Libya
Libya
-
 Lithuania
-
 Luxembourg
-
 Madagascar
-
 Malaysia
-
 Malta
Malta
-
 Mauritius
-
 Mexico
-
 Moldova
-
 Mongolia
-
 Montenegro
-
 Morocco
-
 Mozambique
-
 Myanmar
-
 Namibia
-
 Nepal
Nepal
-
 Netherlands
-
 New Zealand
-
 Nigeria
-
 North Macedonia
-
 Norway
-
 Oman
Oman
-
 Pakistan
-
 Palestine
-
 Panama
-
 Papua New Guinea
-
 Paraguay
-
 Peru
Peru
-
 Philippines
-
 Poland
-
 Portugal
-
 Puerto Rico
-
 Qatar
Qatar
-
 Reunion
-
 Romania
-
 Rwanda
-
 Saudi Arabia
-
 Serbia
-
 Singapore
-
 Slovakia
-
 Slovenia
-
 Somalia
-
 South Africa
-
 Spain
Spain
-
 Sri Lanka
-
 Sweden
-
 Switzerland
-
 Syria
Syria
-
 Taiwan
-
 Tajikistan
-
 Tanzania
-
 Thailand
-
 Trinidad and Tobago
-
 Tunisia
-
 Turkey
-
 UAE
UAE
-
 Uganda
-
 Ukraine
-
 United Kingdom
-
United States
-
 Uruguay
-
 Uzbekistan
-
 Venezuela
-
 Vietnam
-
 Yemen
Yemen
-
 Zambia
-
 Zimbabwe
- Forex
- Crypto












