

What's behind ServiceNow's latest 6.3% stock pullback?

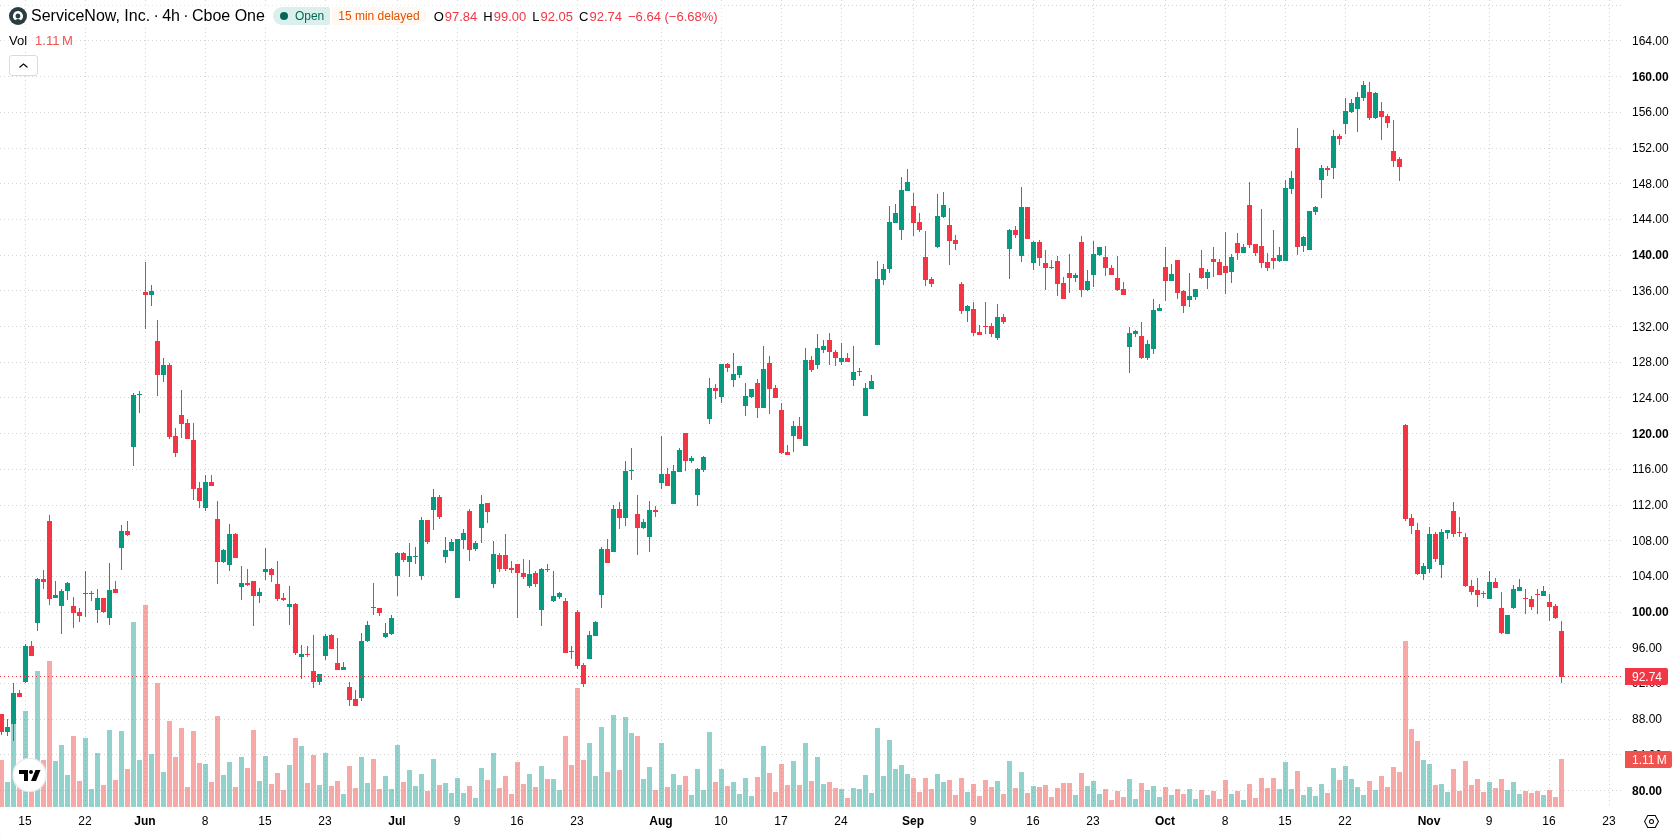
ServiceNow Inc. (NOW) slumped 6.34% after investors reacted to third-quarter 2026 earnings that fell short of expectations and pointed to slowing growth in key performance metrics. The move is supported by strong bearish momentum, as the stock remains below the 20-, 50-, and 200-day moving averages, signaling continued downward pressure.
 98.64
103.62
Highlights
- ServiceNow posted adjusted third-quarter earnings of $1.00 per share, missing consensus by two cents, and projected lower current remaining performance obligations growth of 18.5% for the fourth quarter.
- Subscription revenue increased 20.5% to $4.11 billion, with new AI and automation products announced and restructuring costs totaling $378 million for severance and deferred compensation.
- Shares of ServiceNow fell 6.34% to $93.07 as technical indicators show persistent selling pressure, with a very high probability of a move between $84.23 and $95.44 in the next five days.
Largest single-day drop as guidance and restructuring heighten caution
ServiceNow reported its third-quarter 2026 earnings on October 28, with adjusted earnings of $1.00 per share, coming in two cents below consensus estimates. Shares saw their largest recorded single-day drop after the company's guidance for current remaining performance obligations (cRPO) projected fourth-quarter growth at 18.5% year-over-year, down from 21% in the prior quarter. Subscription revenue was up 20.5% to $4.11 billion, and the company reaffirmed improved cash flow projections. New AI and automation product launches were announced, along with expanded partnerships, and restructuring expenses for the quarter included $167 million in severance costs and $211 million in deferred compensation from recent acquisitions.
Prolonged downtrend as bearish indicators test stretched momentum
ServiceNow is trading below its 20-, 50-, and 200-day moving averages ($121.61, $131.26, and $113.65), indicating sustained bearish trends over the short, medium, and long term. The trading corridor is defined by resistance at $95.44 and support at $92.21. Momentum indicators, including MACD and ADX, register sell signals, reflecting active bearish pressure. RSI and CCI remain neutral, while Stochastic RSI is in the oversold zone, suggesting downside momentum may be stretched and that a technical rebound is possible. Intraday action is dominated by sellers, as shown by the negative Bull/Bear Power.
Earlier, analysts noted that ServiceNow was exhibiting sustained bearish momentum amid reduced growth guidance and technical weakness. The current analysis reinforces this downtrend, highlighting a high-probability risk of further declines with $84.23 as the critical support level to monitor in the near term.






Latest ServiceNow News




-
 Afghanistan
-
 Albania
-
 Algeria
-
 Angola
-
 Argentina
-
 Armenia
-
 Australia
-
 Austria
-
 Azerbaijan
-
 Bahamas
-
 Bahrain
-
 Bangladesh
-
 Belarus
-
 Belgium
-
 Bolivia
-
 Botswana
-
 Brazil
-
 Brunei
-
 Bulgaria
-
 Cambodia
-
 Cameroon
-
 Canada
-
 Chile
-
 China
-
 Colombia
-
 Congo
-
 Costa Rica
-
 Cote d'Ivoire
-
 Croatia
-
 Cuba
-
 Cyprus
-
 Czechia
-
 DR Congo
-
 Denmark
-
 Dominican Republic
-
 Ecuador
-
 Egypt
-
 El Salvador
-
 Estonia
-
 Eswatini
-
 Ethiopia
-
 Finland
-
 France
-
 Georgia
-
 Germany
-
 Ghana
-
 Greece
-
 Haiti
-
 Hong Kong
-
 Hungary
-
 India
-
 Indonesia
-
 Iran, Islamic republic
-
 Iraq
-
 Ireland
-
 Israel
-
 Italy
-
 Jamaica
-
 Japan
-
 Jordan
-
 Kazakhstan
-
 Kenya
-
 Korea
-
 Kuwait
-
 Kyrgyzstan
-
 Laos
-
 Latvia
-
 Lebanon
-
 Lesotho
-
 Libya
-
 Lithuania
-
 Luxembourg
-
 Madagascar
-
 Malaysia
-
 Malta
-
 Mauritius
-
 Mexico
-
 Moldova
-
 Mongolia
-
 Montenegro
-
 Morocco
-
 Mozambique
-
 Myanmar
-
 Namibia
-
 Nepal
-
 Netherlands
-
 New Zealand
-
 Nigeria
-
 North Macedonia
-
 Norway
-
 Oman
-
 Pakistan
-
 Palestine
-
 Panama
-
 Papua New Guinea
-
 Paraguay
-
 Peru
-
 Philippines
-
 Poland
-
 Portugal
-
 Puerto Rico
-
 Qatar
-
 Reunion
-
 Romania
-
 Rwanda
-
 Saudi Arabia
-
 Serbia
-
 Singapore
-
 Slovakia
-
 Slovenia
-
 Somalia
-
 South Africa
-
 Spain
-
 Sri Lanka
-
 Sweden
-
 Switzerland
-
 Syria
-
 Taiwan
-
 Tajikistan
-
 Tanzania
-
 Thailand
-
 Trinidad and Tobago
-
 Tunisia
-
 Turkey
-
 UAE
-
 Uganda
-
 Ukraine
-
 United Kingdom
-
United States
-
 Uruguay
-
 Uzbekistan
-
 Venezuela
-
 Vietnam
-
 Yemen
-
 Zambia
-
 Zimbabwe
- Forex
- Crypto












