

Amgen stock price prediction: Double-digit sales growth strengthens rally outlook

Amgen Inc. (AMGN) stock is trading at $442.51, posting a strong daily gain of 4.02%. The price is positioned above its key short- and long-term moving averages, demonstrating broad technical strength.
 417.76
417.78
417.76
417.78
Highlights
- Amgen stock gained momentum after reporting second-quarter revenue growth of 10% to $10.1 billion and a 65% increase in GAAP earnings per share to $4.37.
- Product sales rose 9% with 22 medicines posting double-digit gains, and six core drugs delivered nearly 70% of product revenue.
- Shares of Amgen trade above key moving averages with a bullish structure; the price is forecast between $434.99 and $450.03, though short-term pullbacks are possible due to overbought readings.
Robust earnings and product sales fuel investor momentum amid research exit
Amgen reported second-quarter revenue growth of 10% to $10.1 billion and a 65% rise in GAAP earnings to $4.37 per share, with Data from Finance Yahoo highlighting product sales up 9%. This strong financial performance reflects robust expansion and margin gains, fueling investor demand and supporting strong price momentum. The company also detailed that twenty-two of its medicines achieved double-digit sales increases, while six key products contributed nearly 70% of product revenue, emphasizing broad portfolio strength. In a secondary development, Tipranks reported that TScan Therapeutics announced Amgen is set to terminate a Crohn's disease research collaboration effective November 10, 2026, though this has a more limited near-term impact compared to the earnings drivers.
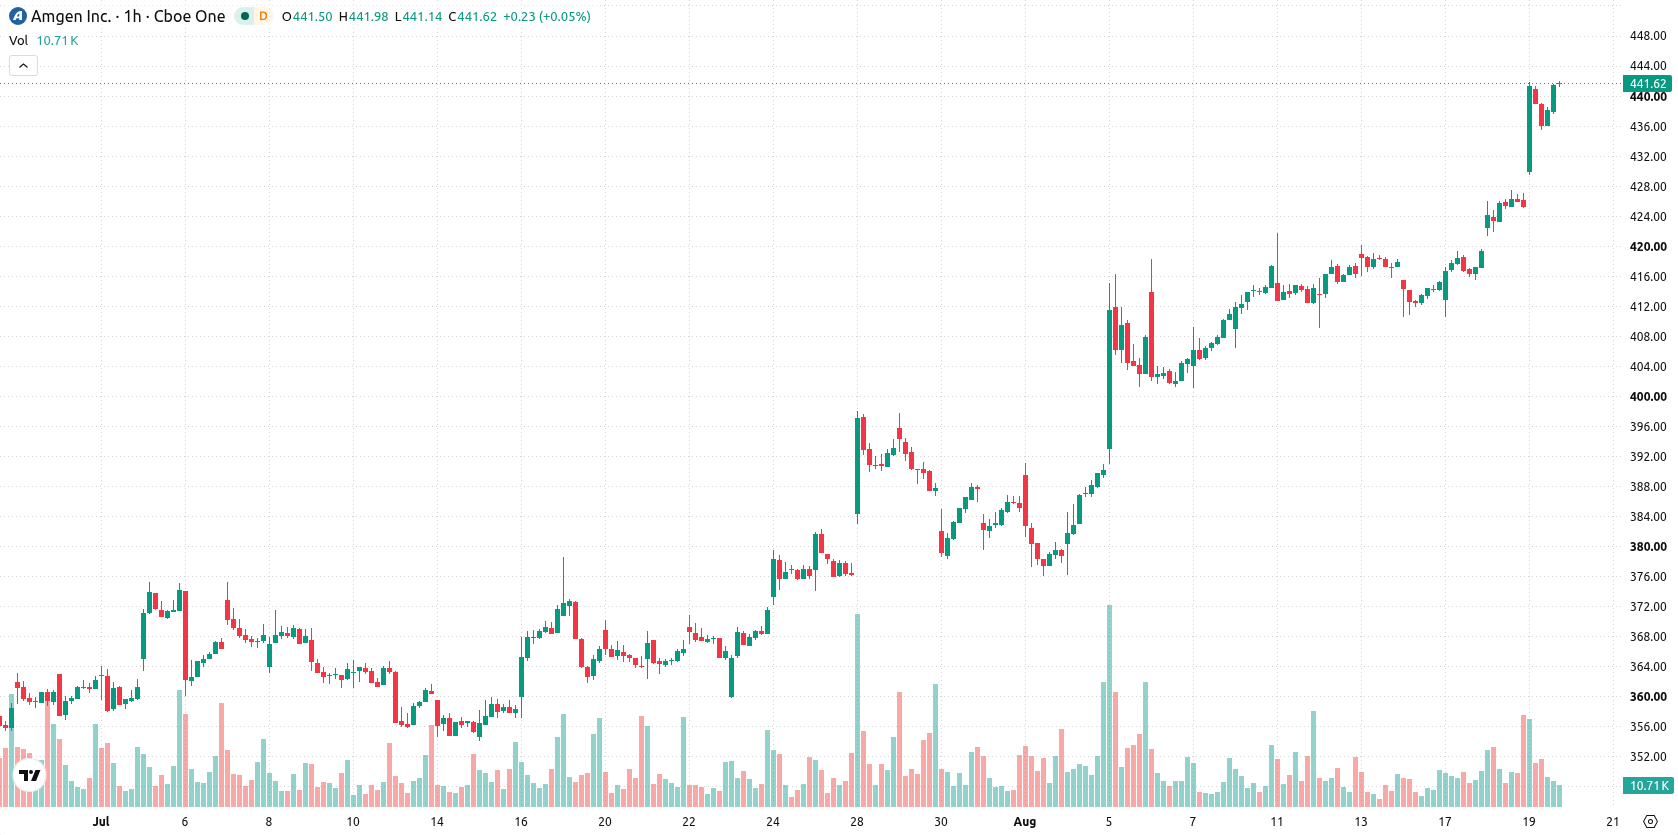
Bullish momentum capped by overbought signals and diverging indicators
On the technical side, AMGN is trading above the MA-20 ($426.75) and MA-50 ($419.9) on the H1 chart, as well as well above the MA-200 ($350.68) on the daily timeframe. Immediate support is identified at the Ichimoku Kijun level of $426.12. Momentum indicators on the H1 chart remain bullish, with both MACD and ADX signaling continued buying pressure. However, RSI at 76.26 and CCI readings indicate overbought conditions, while Stochastic RSI is suggesting the potential for a downside retracement. Buyers are still in control intraday, as shown by Bull/Bear Power dominance, though the Awesome Oscillator is currently neutral, and several momentum indicators are diverging, which highlights the potential for pullbacks.
Sideways or upside bias persists as breakout and reversal risks diverge
In the short term, the most likely scenario sees AMGN ranging between $434.99 and $450.03, consistent with typical volatility for the current environment. The probability of further gains is 71%, favoring sideways or continued upside movement, while a reversal lower is less likely at 29%. A breakout above resistance could trigger a renewed uptrend, while a close below support at the Kijun level would raise the risk of deeper corrective action.
Earlier, analysts noted that Amgen maintained a bullish technical outlook, underpinned by strong fundamentals and positive momentum signals. The current article reinforces this view with fresh evidence of robust earnings growth and broad portfolio performance, while traders should monitor price action near the $434.99–$450.03 range for signs of a potential breakout or corrective pullback.










-
 Afghanistan
-
 Albania
-
 Algeria
-
 Angola
-
 Argentina
-
 Armenia
-
 Australia
-
 Austria
-
 Azerbaijan
-
 Bahamas
-
 Bahrain
-
 Bangladesh
-
 Belarus
-
 Belgium
-
 Bolivia
-
 Botswana
-
 Brazil
-
 Brunei
-
 Bulgaria
-
 Cambodia
-
 Cameroon
-
 Canada
-
 Chile
Chile
-
 China
China
-
 Colombia
-
 Congo
Congo
-
 Costa Rica
-
 Cote d'Ivoire
-
 Croatia
-
 Cuba
Cuba
-
 Cyprus
-
 Czechia
-
 DR Congo
-
 Denmark
-
 Dominican Republic
-
 Ecuador
-
 Egypt
Egypt
-
 El Salvador
-
 Estonia
-
 Eswatini
-
 Ethiopia
-
 Finland
-
 France
-
 Georgia
-
 Germany
-
 Ghana
Ghana
-
 Greece
-
 Haiti
Haiti
-
 Hong Kong
-
 Hungary
-
 India
India
-
 Indonesia
-
 Iran, Islamic republic
-
 Iraq
Iraq
-
 Ireland
-
 Israel
-
 Italy
Italy
-
 Jamaica
-
 Japan
Japan
-
 Jordan
-
 Kazakhstan
-
 Kenya
Kenya
-
 Korea
Korea
-
 Kuwait
-
 Kyrgyzstan
-
 Laos
Laos
-
 Latvia
-
 Lebanon
-
 Lesotho
-
 Libya
Libya
-
 Lithuania
-
 Luxembourg
-
 Madagascar
-
 Malaysia
-
 Malta
Malta
-
 Mauritius
-
 Mexico
-
 Moldova
-
 Mongolia
-
 Montenegro
-
 Morocco
-
 Mozambique
-
 Myanmar
-
 Namibia
-
 Nepal
Nepal
-
 Netherlands
-
 New Zealand
-
 Nigeria
-
 North Macedonia
-
 Norway
-
 Oman
Oman
-
 Pakistan
-
 Palestine
-
 Panama
-
 Papua New Guinea
-
 Paraguay
-
 Peru
Peru
-
 Philippines
-
 Poland
-
 Portugal
-
 Puerto Rico
-
 Qatar
Qatar
-
 Reunion
-
 Romania
-
 Rwanda
-
 Saudi Arabia
-
 Serbia
-
 Singapore
-
 Slovakia
-
 Slovenia
-
 Somalia
-
 South Africa
-
 Spain
Spain
-
 Sri Lanka
-
 Sweden
-
 Switzerland
-
 Syria
Syria
-
 Taiwan
-
 Tajikistan
-
 Tanzania
-
 Thailand
-
 Trinidad and Tobago
-
 Tunisia
-
 Turkey
-
 UAE
UAE
-
 Uganda
-
 Ukraine
-
 United Kingdom
-
United States
-
 Uruguay
-
 Uzbekistan
-
 Venezuela
-
 Vietnam
-
 Yemen
Yemen
-
 Zambia
-
 Zimbabwe
- Forex
- Crypto












