

Hims & Hers Health shares technical analysis: Rally tests $33.06 resistance

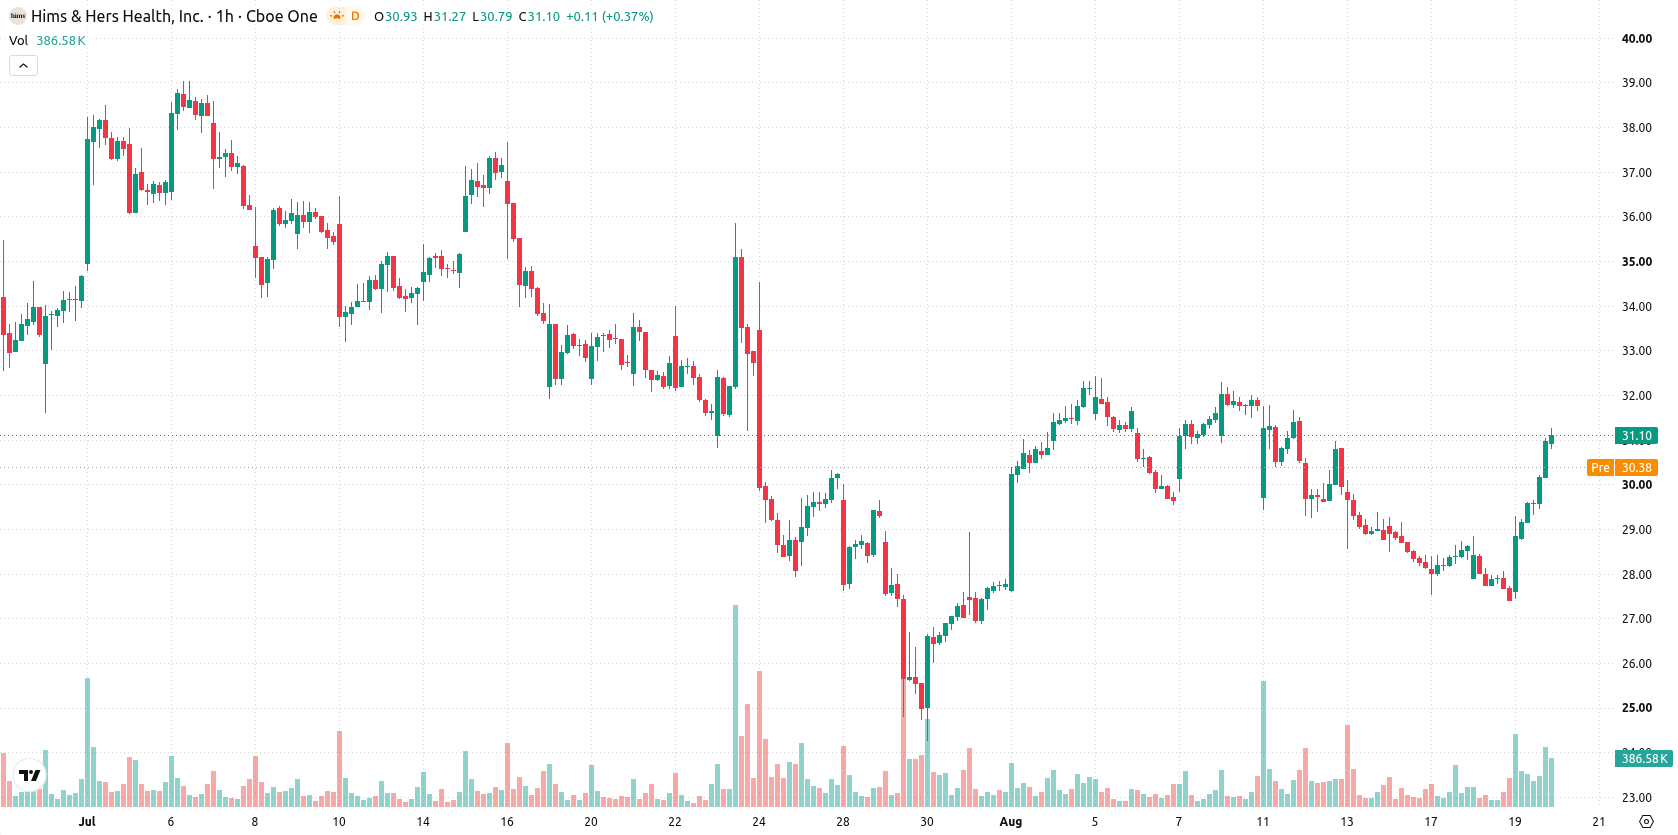
Hims & Hers Health (HIMS) stock is trading at $31.09, up 13.51% on the day and sitting above its key moving averages. The price action is positioned well above short-, medium-, and long-term trend levels, reflecting strong momentum.
 26.23
28.61
Highlights
- Executives at Hims & Hers Health completed scheduled insider share sales for tax withholding, preserving significant management stakes.
- The company faces regulatory headwinds from an FTC lawsuit and a corporate compliance investigation now in progress.
- Hims & Hers Health stock gained 13.51% to $31.09 with strong bullish momentum and is projected to trade between $29.38 and $33.06 over the coming days.
Executive share sales framed as routine amid regulatory scrutiny
Recent insider transactions by Hims & Hers Health's top executives have dominated the news, with CEO Andrew Dudum's disposal of 78,859 shares and similar sales by CTO Mohamed Elshenawy and Chief Legal Officer Soleil Boughton, all executed for routine tax withholding after the company's second-quarter earnings results, according to Foreignpolicyjournal and Fool. By framing these insider sales as mandated, non-discretionary moves while maintaining substantial management ownership, the company limits negative interpretation of the activity and underscores executive alignment with shareholders. Regulatory actions continue to overlay the backdrop following the FTC lawsuit filed on July 29 and the subsequent Hagens Berman investigation into corporate compliance, as reported by Prnewswire, though these developments have been contextualized amid procedural insider activity rather than discretionary selling.
Overbought signals build as price holds above technical floors
Technically, HIMS is trading above the MA-20 ($28.73) and MA-50 ($29.29) on the hourly chart, as well as above the MA-200 ($29.01) on the daily chart. The Ichimoku Kijun at $29.29 now acts as immediate support for the price. Momentum signals are robust, with MACD and ADX registering Buy signals, an RSI reading of 73.75, and overbought conditions confirmed by Stochastic RSI, CCI, and Bull/Bear Power. The Awesome Oscillator also supports upward momentum, matching the current trend of strong intraday activity and high volatility.
Breakout potential rises as price consolidates in narrow band
In the short term, HIMS is expected to fluctuate in a range between $29.38 and $33.06. The probability of a further upward move is estimated at 70%, with downside risk at 30%. The baseline scenario envisages consolidation within this band, but a break above resistance could accelerate gains, while a failure to hold the immediate support at $29.29 may open the door to a pullback toward the lower bound.
Earlier, analysts noted that Hims & Hers Health was facing persistent downside pressure as technical indicators remained weak and legal uncertainties weighed on sentiment. The current article signals a material shift, with strong upward price momentum now prevailing above critical technical levels, making the $29.29 area a key support to monitor for potential trend continuation or reversal.






Latest Hims & Hers News





-
 Afghanistan
-
 Albania
-
 Algeria
-
 Angola
-
 Argentina
-
 Armenia
-
 Australia
-
 Austria
-
 Azerbaijan
-
 Bahamas
-
 Bahrain
-
 Bangladesh
-
 Belarus
-
 Belgium
-
 Bolivia
-
 Botswana
-
 Brazil
-
 Brunei
-
 Bulgaria
-
 Cambodia
-
 Cameroon
-
 Canada
-
 Chile
-
 China
-
 Colombia
-
 Congo
-
 Costa Rica
-
 Cote d'Ivoire
-
 Croatia
-
 Cuba
-
 Cyprus
-
 Czechia
-
 DR Congo
-
 Denmark
-
 Dominican Republic
-
 Ecuador
-
 Egypt
-
 El Salvador
-
 Estonia
-
 Eswatini
-
 Ethiopia
-
 Finland
-
 France
-
 Georgia
-
 Germany
-
 Ghana
-
 Greece
-
 Haiti
-
 Hong Kong
-
 Hungary
-
 India
-
 Indonesia
-
 Iran, Islamic republic
-
 Iraq
-
 Ireland
-
 Israel
-
 Italy
-
 Jamaica
-
 Japan
-
 Jordan
-
 Kazakhstan
-
 Kenya
-
 Korea
-
 Kuwait
-
 Kyrgyzstan
-
 Laos
-
 Latvia
-
 Lebanon
-
 Lesotho
-
 Libya
-
 Lithuania
-
 Luxembourg
-
 Madagascar
-
 Malaysia
-
 Malta
-
 Mauritius
-
 Mexico
-
 Moldova
-
 Mongolia
-
 Montenegro
-
 Morocco
-
 Mozambique
-
 Myanmar
-
 Namibia
-
 Nepal
-
 Netherlands
-
 New Zealand
-
 Nigeria
-
 North Macedonia
-
 Norway
-
 Oman
-
 Pakistan
-
 Palestine
-
 Panama
-
 Papua New Guinea
-
 Paraguay
-
 Peru
-
 Philippines
-
 Poland
-
 Portugal
-
 Puerto Rico
-
 Qatar
-
 Reunion
-
 Romania
-
 Rwanda
-
 Saudi Arabia
-
 Serbia
-
 Singapore
-
 Slovakia
-
 Slovenia
-
 Somalia
-
 South Africa
-
 Spain
-
 Sri Lanka
-
 Sweden
-
 Switzerland
-
 Syria
-
 Taiwan
-
 Tajikistan
-
 Tanzania
-
 Thailand
-
 Trinidad and Tobago
-
 Tunisia
-
 Turkey
-
 UAE
-
 Uganda
-
 Ukraine
-
 United Kingdom
-
United States
-
 Uruguay
-
 Uzbekistan
-
 Venezuela
-
 Vietnam
-
 Yemen
-
 Zambia
-
 Zimbabwe
- Forex
- Crypto












