

Diamondback Energy stock rises over 3% as bullish technical momentum propels gains

Diamondback Energy, Inc. (FANG) surged 3.15% as bullish technical momentum and strong near-term buying interest drove today's gains. The sustained move is supported by the stock trading above its 20-day, 50-day, and 200-day simple moving averages, with buyers dominating the session despite caution from overbought oscillators.
 182.30
185.92
Highlights
- Diamondback Energy stock trades in a clear bullish structure above key moving averages across all timeframes.
- Multiple momentum oscillators indicate overbought conditions and neutral trend strength, raising the likelihood of consolidation near-term.
- Shares are expected to move in a range of $204 to $221.56 over the next 5 days with a 74% probability of an increase.
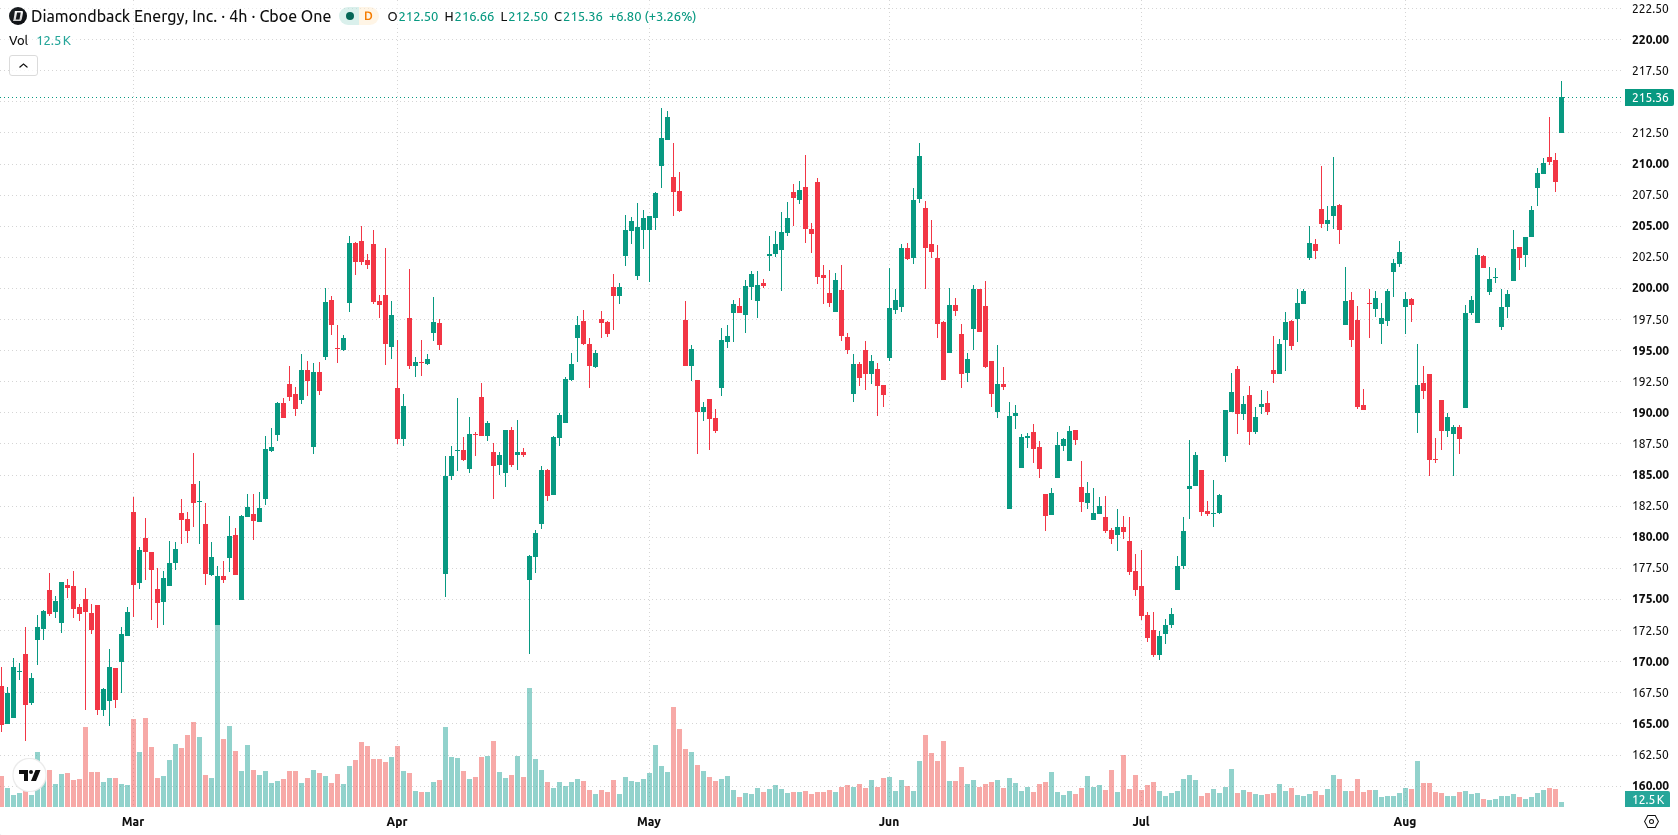
Upside strength sustained as multiple indicators signal overbought risk
The stock is trading above its 20-day ($199.05), 50-day ($191.73), and 200-day ($177.32) simple moving averages, signaling a bullish structure across short, medium, and long-term trends. Support is established at $213.73, with resistance at $221.56. The Ichimoku Kijun ($199.29) provides additional trend support. Bullish momentum is evident in the MACD buy signal and a positive Awesome Oscillator, but the ADX at 13.24 suggests neutral trend strength. The RSI stands at 61.54, backing a buy forecast, while both the Stochastic RSI (90.81) and CCI (142.94) indicate overbought conditions. Bull/Bear Power at 12.28 further confirms dominant buying activity, also in overbought territory. A $2.06 opening upside gap (0.99%) and a 2.86% volatility amplitude underscore the session’s strong upward tone, though overbought signals hint at a possible near-term pause or consolidation.
Earlier, analysts noted that Diamondback Energy was exhibiting sustained bullish momentum with technical indicators pointing to an upward bias. With current technical signals showing persistent buying interest but also overbought conditions, traders should monitor the $221.56 resistance level for confirmation of a potential breakout.






Latest Diamondback Energy News




-
 Afghanistan
-
 Albania
-
 Algeria
-
 Angola
-
 Argentina
-
 Armenia
-
 Australia
-
 Austria
-
 Azerbaijan
-
 Bahamas
-
 Bahrain
-
 Bangladesh
-
 Belarus
-
 Belgium
-
 Bolivia
-
 Botswana
-
 Brazil
-
 Brunei
-
 Bulgaria
-
 Cambodia
-
 Cameroon
-
 Canada
-
 Chile
-
 China
-
 Colombia
-
 Congo
-
 Costa Rica
-
 Cote d'Ivoire
-
 Croatia
-
 Cuba
-
 Cyprus
-
 Czechia
-
 DR Congo
-
 Denmark
-
 Dominican Republic
-
 Ecuador
-
 Egypt
-
 El Salvador
-
 Estonia
-
 Eswatini
-
 Ethiopia
-
 Finland
-
 France
-
 Georgia
-
 Germany
-
 Ghana
-
 Greece
-
 Haiti
-
 Hong Kong
-
 Hungary
-
 India
-
 Indonesia
-
 Iran, Islamic republic
-
 Iraq
-
 Ireland
-
 Israel
-
 Italy
-
 Jamaica
-
 Japan
-
 Jordan
-
 Kazakhstan
-
 Kenya
-
 Korea
-
 Kuwait
-
 Kyrgyzstan
-
 Laos
-
 Latvia
-
 Lebanon
-
 Lesotho
-
 Libya
-
 Lithuania
-
 Luxembourg
-
 Madagascar
-
 Malaysia
-
 Malta
-
 Mauritius
-
 Mexico
-
 Moldova
-
 Mongolia
-
 Montenegro
-
 Morocco
-
 Mozambique
-
 Myanmar
-
 Namibia
-
 Nepal
-
 Netherlands
-
 New Zealand
-
 Nigeria
-
 North Macedonia
-
 Norway
-
 Oman
-
 Pakistan
-
 Palestine
-
 Panama
-
 Papua New Guinea
-
 Paraguay
-
 Peru
-
 Philippines
-
 Poland
-
 Portugal
-
 Puerto Rico
-
 Qatar
-
 Reunion
-
 Romania
-
 Rwanda
-
 Saudi Arabia
-
 Serbia
-
 Singapore
-
 Slovakia
-
 Slovenia
-
 Somalia
-
 South Africa
-
 Spain
-
 Sri Lanka
-
 Sweden
-
 Switzerland
-
 Syria
-
 Taiwan
-
 Tajikistan
-
 Tanzania
-
 Thailand
-
 Trinidad and Tobago
-
 Tunisia
-
 Turkey
-
 UAE
-
 Uganda
-
 Ukraine
-
 United Kingdom
-
United States
-
 Uruguay
-
 Uzbekistan
-
 Venezuela
-
 Vietnam
-
 Yemen
-
 Zambia
-
 Zimbabwe
- Forex
- Crypto












