

What's behind Diamondback Energy's latest 8.5% stock pullback?

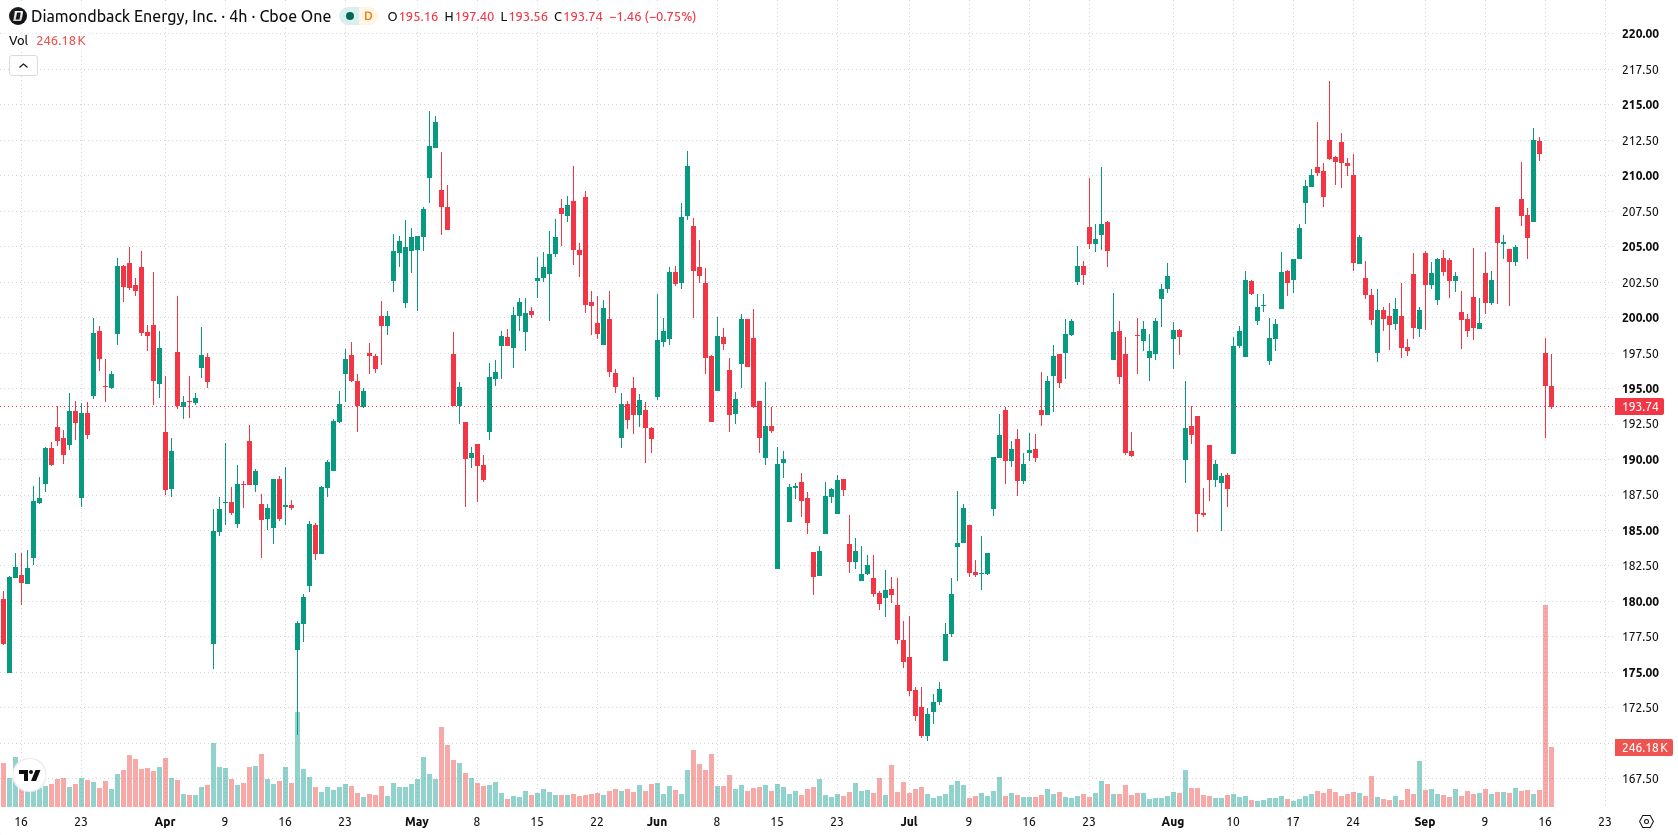
Diamondback Energy, Inc. (FANG) slid 8.48% as sustained seller momentum drove an intraday reversal, even as the company reported a sharp revenue increase and expanded its capital returns. The move is contradicted by the asset holding above its long-term 200-day moving average, with technical signals suggesting stretched market conditions rather than a fundamental shift.
 180.25
191.00
Highlights
- Diamondback Energy reported quarterly revenue up 51.2% year over year, with free cash flow remaining strong.
- The company paid a $1.10 per share quarterly dividend, annualizing to a yield of about 2.1%, and expanded its share buyback authorization.
- Shares of Diamondback Energy fell 8.48% to $193.58, trading below near-term moving averages under seller pressure, with a forecasted 5-day range of $171.9 to $199.78.
Institutional flows muted as buybacks and earnings fail to offset pressure
Diamondback Energy reported a 51.2% increase in quarterly revenue compared to the same period last year. The company paid a quarterly dividend of $1.10 per share, resulting in an annualized yield of approximately 2.1%. Expanded buyback authorization and robust free cash flow were also noted by institutional coverage, though price action has remained under broader selling pressure.
Seller dominance persists as short-term trend clashes with long-term support
FANG is trading below its 20-day ($204.16) and 50-day ($198.68) moving averages, reflecting both near-term and medium-term seller pressure. However, the current price is supported by the 200-day moving average at $182.59, maintaining a bullish long-term trend structure. Near-term reference levels are defined by resistance at $198.11 and support at $191.77. Momentum signals are mixed: MACD indicates a buy, but the ADX at 13.19 suggests a neutral trend. The Relative Strength Index (RSI) is overbought at 63.74, as are the Stochastic RSI at 100, Commodity Channel Index (CCI) at 113.79, and Bull/Bear Power (BBP) at 9.05, all pointing to strong buyer dominance intraday. The Awesome Oscillator (AO) favors bullish momentum. Intraday volatility is elevated at 3.31%, and the last session showed sustained selling after a large downside gap, with momentum indicators appearing stretched.
Earlier, analysts noted that Diamondback Energy was exhibiting sustained bullish momentum with technical indicators pointing to an upward bias. With technical signals now showing mixed momentum alongside elevated volatility, traders should watch for confirmation of a break above $198.11 or a sustained move below $191.77 to determine the next directional move.






Latest Diamondback Energy News




-
 Afghanistan
-
 Albania
-
 Algeria
-
 Angola
-
 Argentina
-
 Armenia
-
 Australia
-
 Austria
-
 Azerbaijan
-
 Bahamas
-
 Bahrain
-
 Bangladesh
-
 Belarus
-
 Belgium
-
 Bolivia
-
 Botswana
-
 Brazil
-
 Brunei
-
 Bulgaria
-
 Cambodia
-
 Cameroon
-
 Canada
-
 Chile
-
 China
-
 Colombia
-
 Congo
-
 Costa Rica
-
 Cote d'Ivoire
-
 Croatia
-
 Cuba
-
 Cyprus
-
 Czechia
-
 DR Congo
-
 Denmark
-
 Dominican Republic
-
 Ecuador
-
 Egypt
-
 El Salvador
-
 Estonia
-
 Eswatini
-
 Ethiopia
-
 Finland
-
 France
-
 Georgia
-
 Germany
-
 Ghana
-
 Greece
-
 Haiti
-
 Hong Kong
-
 Hungary
-
 India
-
 Indonesia
-
 Iran, Islamic republic
-
 Iraq
-
 Ireland
-
 Israel
-
 Italy
-
 Jamaica
-
 Japan
-
 Jordan
-
 Kazakhstan
-
 Kenya
-
 Korea
-
 Kuwait
-
 Kyrgyzstan
-
 Laos
-
 Latvia
-
 Lebanon
-
 Lesotho
-
 Libya
-
 Lithuania
-
 Luxembourg
-
 Madagascar
-
 Malaysia
-
 Malta
-
 Mauritius
-
 Mexico
-
 Moldova
-
 Mongolia
-
 Montenegro
-
 Morocco
-
 Mozambique
-
 Myanmar
-
 Namibia
-
 Nepal
-
 Netherlands
-
 New Zealand
-
 Nigeria
-
 North Macedonia
-
 Norway
-
 Oman
-
 Pakistan
-
 Palestine
-
 Panama
-
 Papua New Guinea
-
 Paraguay
-
 Peru
-
 Philippines
-
 Poland
-
 Portugal
-
 Puerto Rico
-
 Qatar
-
 Reunion
-
 Romania
-
 Rwanda
-
 Saudi Arabia
-
 Serbia
-
 Singapore
-
 Slovakia
-
 Slovenia
-
 Somalia
-
 South Africa
-
 Spain
-
 Sri Lanka
-
 Sweden
-
 Switzerland
-
 Syria
-
 Taiwan
-
 Tajikistan
-
 Tanzania
-
 Thailand
-
 Trinidad and Tobago
-
 Tunisia
-
 Turkey
-
 UAE
-
 Uganda
-
 Ukraine
-
 United Kingdom
-
United States
-
 Uruguay
-
 Uzbekistan
-
 Venezuela
-
 Vietnam
-
 Yemen
-
 Zambia
-
 Zimbabwe
- Forex
- Crypto












