

WMT slides as second quarter U.S. sales growth misses expectations

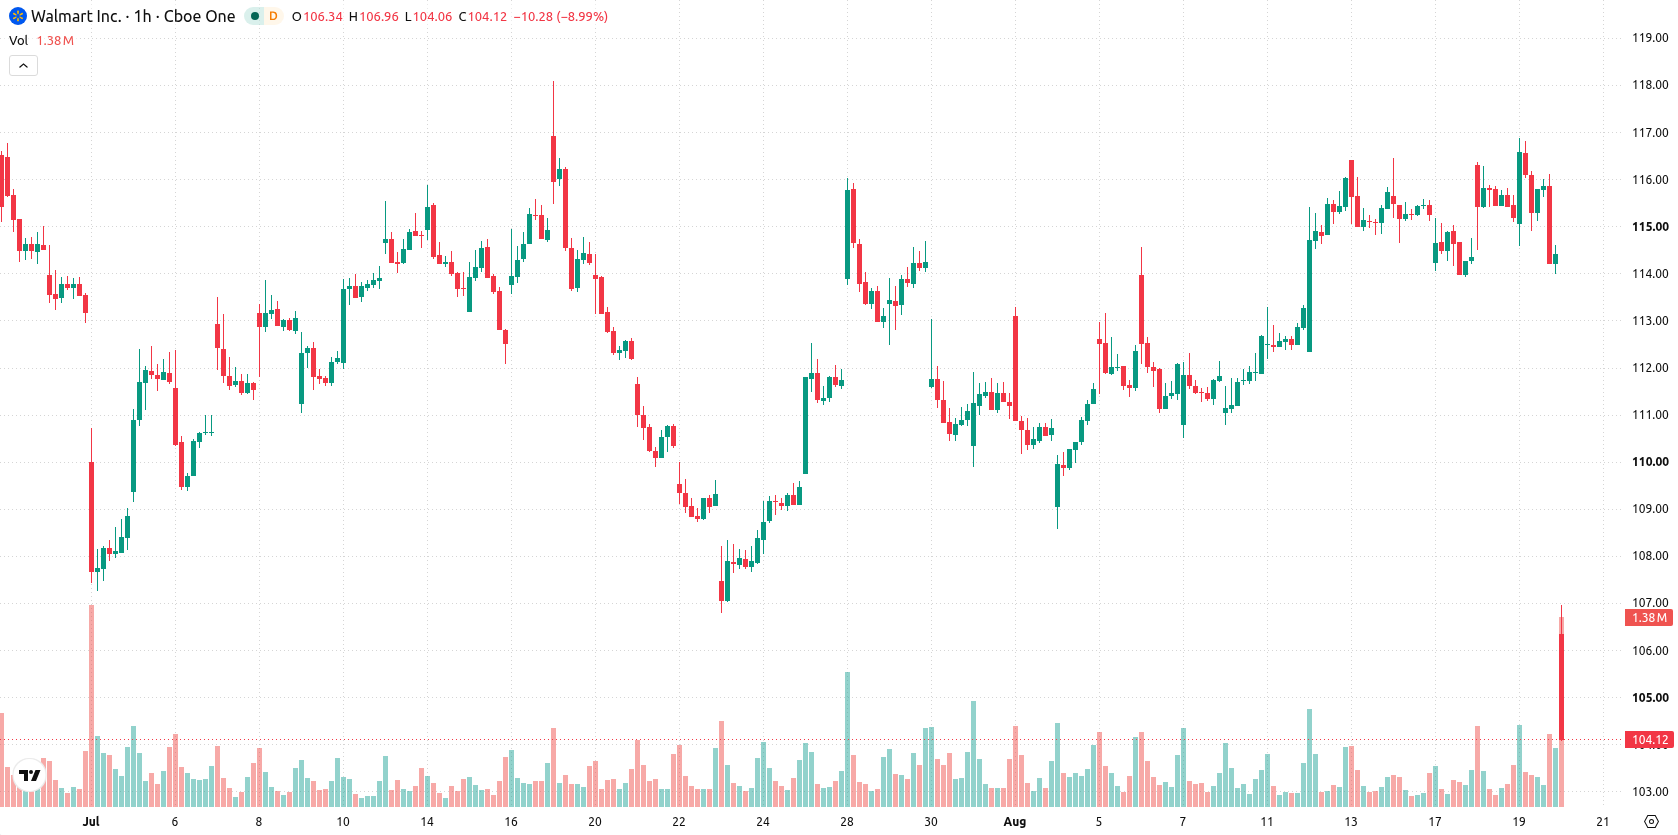
Walmart (WMT) stock is trading at $104.4, down 8.67% on the day. The price currently sits below its key moving averages, reflecting a continuation of the recent downward momentum.
 129.77
Highlights
- Walmart posted second quarter U.S. sales growth of 2.6%, below analyst expectations, but exceeded overall earnings and sales estimates.
- Management raised full-year guidance after a third quarter EPS beat to $0.81 and 5.9% year-over-year revenue growth, but forecasted future EPS and revenue below consensus.
- Shares of Walmart are down 8.67% to $104.4, trading below key moving averages with seller pressure dominating and a projected short-term range of $103.08 to $114.07.
Mixed guidance tempers optimism after earnings and sales beats
Walmart reported second quarter U.S. sales growth of 2.6%, falling short of analyst expectations and highlighting a softer expansion in its key domestic market, according to Gurufocus. The company nevertheless exceeded Wall Street estimates on overall sales and earnings and raised its full-year financial outlook, suggesting underlying operational resilience, as reported by Finance Yahoo. Walmart also delivered a third quarter earnings beat with EPS of $0.81 and reported 5.9% year-over-year revenue growth, yet management's updated forward guidance for EPS and revenue was issued below consensus, indicating a more cautious outlook per MarketBeat and Businesswire.
Technical weakness persists as oversold signals clash with strong sellers
WMT is trading below the MA-20 at $115.16 and the MA-50 at $114.81 on the H1 chart, with the daily MA-200 at $118.5 acting as the long-term barrier. Immediate resistance is set by the Ichimoku Kijun at $115.4. Momentum indicators show a split picture: MACD and ADX reflect strong buying pressure, while the RSI at 43.21 flags ongoing weakness. Stochastic RSI and CCI both indicate oversold conditions; Bull/Bear Power is also oversold, and the Awesome Oscillator confirms continued seller dominance at intraday levels.
Range-bound trading persists as breakout levels define next move
WMT is expected to remain range-bound between $103.08 and $114.07 over the next 2–3 trading days, corresponding to a typical volatility band relative to current levels. The probability of an upward move stands at 57%, with a less likely 43% chance for further downside. Stability within this zone is the baseline scenario, but a decisive break above $115.4 would open the door for a short-term rebound, while sustained selling below $103.08 would extend the recent decline.
Earlier, analysts noted that Walmart’s weak guidance and softer U.S. sales outlook had placed the stock under pressure, with lingering questions about the durability of its growth. The latest technical setup adds a layer of caution, making a sustained move above $115.4 a critical level for any short-term reversal in the stock’s downtrend.











-
 Afghanistan
-
 Albania
-
 Algeria
-
 Angola
-
 Argentina
-
 Armenia
-
 Australia
-
 Austria
-
 Azerbaijan
-
 Bahamas
-
 Bahrain
-
 Bangladesh
-
 Belarus
-
 Belgium
-
 Bolivia
-
 Botswana
-
 Brazil
-
 Brunei
-
 Bulgaria
-
 Cambodia
-
 Cameroon
-
 Canada
-
 Chile
-
 China
-
 Colombia
-
 Congo
-
 Costa Rica
-
 Cote d'Ivoire
-
 Croatia
-
 Cuba
-
 Cyprus
-
 Czechia
-
 DR Congo
-
 Denmark
-
 Dominican Republic
-
 Ecuador
-
 Egypt
-
 El Salvador
-
 Estonia
-
 Eswatini
-
 Ethiopia
-
 Finland
-
 France
-
 Georgia
-
 Germany
-
 Ghana
-
 Greece
-
 Haiti
-
 Hong Kong
-
 Hungary
-
 India
-
 Indonesia
-
 Iran, Islamic republic
-
 Iraq
-
 Ireland
-
 Israel
-
 Italy
-
 Jamaica
-
 Japan
-
 Jordan
-
 Kazakhstan
-
 Kenya
-
 Korea
-
 Kuwait
-
 Kyrgyzstan
-
 Laos
-
 Latvia
-
 Lebanon
-
 Lesotho
-
 Libya
-
 Lithuania
-
 Luxembourg
-
 Madagascar
-
 Malaysia
-
 Malta
-
 Mauritius
-
 Mexico
-
 Moldova
-
 Mongolia
-
 Montenegro
-
 Morocco
-
 Mozambique
-
 Myanmar
-
 Namibia
-
 Nepal
-
 Netherlands
-
 New Zealand
-
 Nigeria
-
 North Macedonia
-
 Norway
-
 Oman
-
 Pakistan
-
 Palestine
-
 Panama
-
 Papua New Guinea
-
 Paraguay
-
 Peru
-
 Philippines
-
 Poland
-
 Portugal
-
 Puerto Rico
-
 Qatar
-
 Reunion
-
 Romania
-
 Rwanda
-
 Saudi Arabia
-
 Serbia
-
 Singapore
-
 Slovakia
-
 Slovenia
-
 Somalia
-
 South Africa
-
 Spain
-
 Sri Lanka
-
 Sweden
-
 Switzerland
-
 Syria
-
 Taiwan
-
 Tajikistan
-
 Tanzania
-
 Thailand
-
 Trinidad and Tobago
-
 Tunisia
-
 Turkey
-
 UAE
-
 Uganda
-
 Ukraine
-
 United Kingdom
-
United States
-
 Uruguay
-
 Uzbekistan
-
 Venezuela
-
 Vietnam
-
 Yemen
-
 Zambia
-
 Zimbabwe
- Forex
- Crypto












