


Home Depot, Inc (HD) extended its downturn by 2.36% following broader selling pressure that took hold after a weak open, even as strong second-quarter results and a dividend increase were reported. The decline is reinforced by the stock trading below all its key moving averages, with technical structure limiting any immediate rebound.
 349.34
356.88
Highlights
- Home Depot posted second quarter earnings per share of $4.92 on revenue of $47.86 billion, both above market expectations.
- Comparable store sales grew 1.7% with stronger online activity and steady professional demand, and the quarterly dividend was raised to $2.33 per share.
- Shares of Home Depot are trading below key moving averages and face ongoing selling pressure, with the next five-session range expected between $326.52 and $346.01.
Upbeat earnings and dividend hike met with persistent market negativity
Home Depot reported strong financial results for the second quarter of fiscal 2026, with earnings per share of $4.92, surpassing market expectations. Revenue reached $47.86 billion, and comparable store sales increased by 1.7%, supported by higher online sales and sustained professional demand. The company reaffirmed its full-year guidance and raised its quarterly dividend to $2.33 per share, marking the 156th consecutive payout, though price action has remained under broader selling pressure.
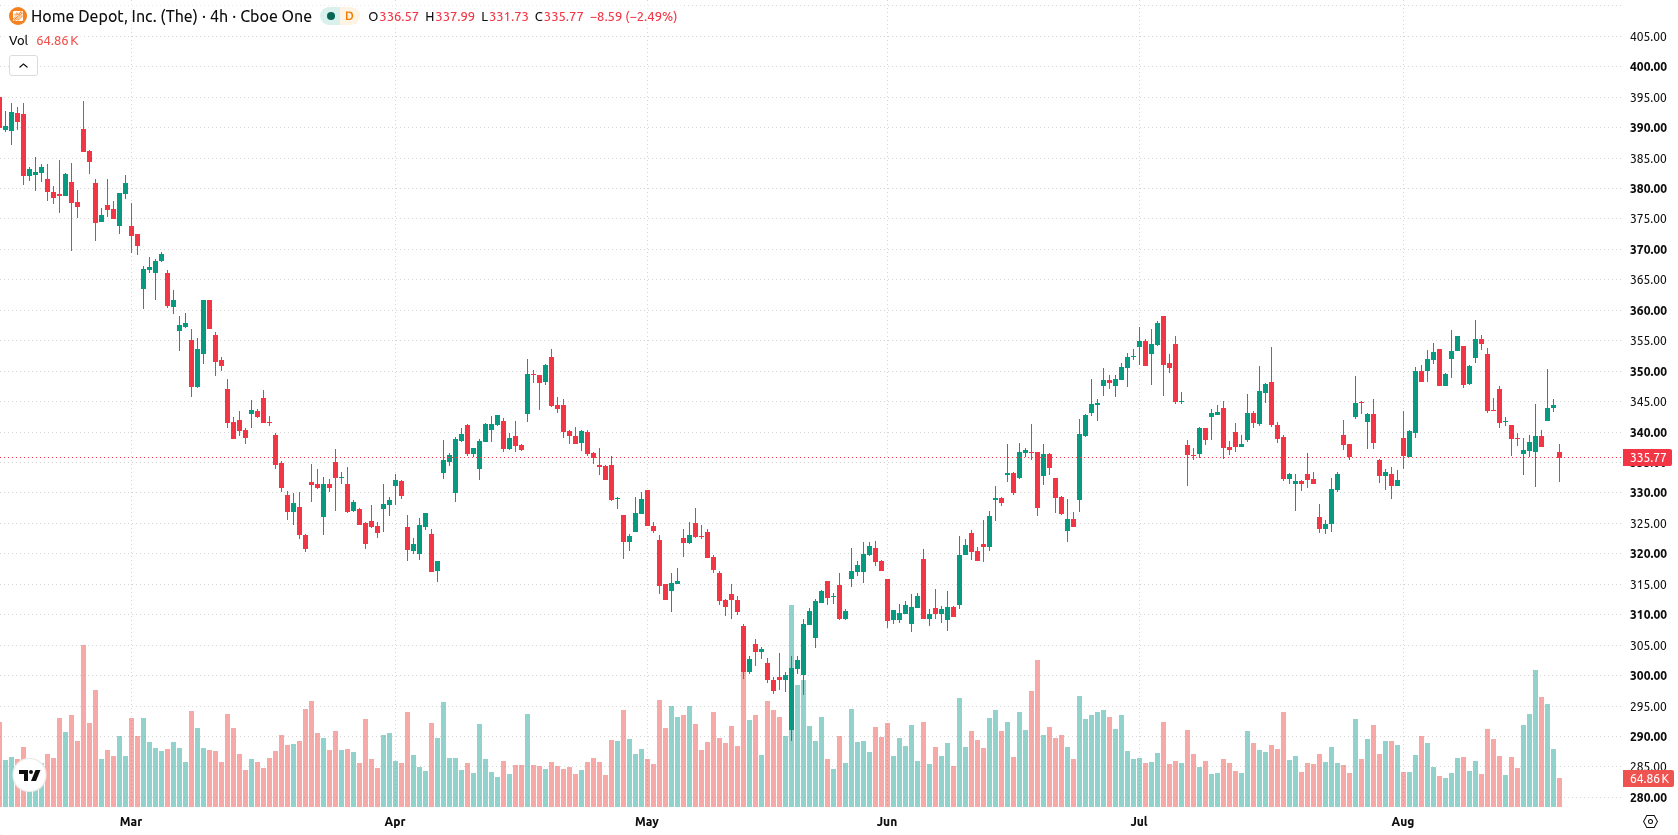
Seller control as moving averages and mixed momentum conflict
Home Depot is trading below all major moving averages, with the price below the MA-20 at $341.83, the MA-50 at $339.46, and the MA-200 at $346.48. This setup signals ongoing seller dominance across short, medium, and long-term trends, and the alignment between the MA-50 and MA-200 remains bearish. The nearest resistance level is at $338.06, and immediate support is noted at $333.5. Momentum indicators are mixed: the MACD indicates a strong buy, yet the ADX remains neutral, pointing to a lack of strong trend, while both the RSI and Stochastic RSI suggest buying conditions without signs of overbought risk. The CCI is neutral, and BBP is positive at 7.47, reflecting intraday buyer strength, though there is a note of caution for potential overbought conditions.
Earlier, analysts noted that Home Depot shares were trading in a narrow, range-bound pattern with mixed technical signals and a negative longer-term bias. The current setup builds on this by highlighting persistent seller dominance and aligning technical structure, with traders advised to watch for a decisive move above $338.06 resistance or below $333.5 support as the next direction catalyst.









-
 Afghanistan
-
 Albania
-
 Algeria
-
 Angola
-
 Argentina
-
 Armenia
-
 Australia
-
 Austria
-
 Azerbaijan
-
 Bahamas
-
 Bahrain
-
 Bangladesh
-
 Belarus
-
 Belgium
-
 Bolivia
-
 Botswana
-
 Brazil
-
 Brunei
-
 Bulgaria
-
 Cambodia
-
 Cameroon
-
 Canada
-
 Chile
-
 China
-
 Colombia
-
 Congo
-
 Costa Rica
-
 Cote d'Ivoire
-
 Croatia
-
 Cuba
-
 Cyprus
-
 Czechia
-
 DR Congo
-
 Denmark
-
 Dominican Republic
-
 Ecuador
-
 Egypt
-
 El Salvador
-
 Estonia
-
 Eswatini
-
 Ethiopia
-
 Finland
-
 France
-
 Georgia
-
 Germany
-
 Ghana
-
 Greece
-
 Haiti
-
 Hong Kong
-
 Hungary
-
 India
-
 Indonesia
-
 Iran, Islamic republic
-
 Iraq
-
 Ireland
-
 Israel
-
 Italy
-
 Jamaica
-
 Japan
-
 Jordan
-
 Kazakhstan
-
 Kenya
-
 Korea
-
 Kuwait
-
 Kyrgyzstan
-
 Laos
-
 Latvia
-
 Lebanon
-
 Lesotho
-
 Libya
-
 Lithuania
-
 Luxembourg
-
 Madagascar
-
 Malaysia
-
 Malta
-
 Mauritius
-
 Mexico
-
 Moldova
-
 Mongolia
-
 Montenegro
-
 Morocco
-
 Mozambique
-
 Myanmar
-
 Namibia
-
 Nepal
-
 Netherlands
-
 New Zealand
-
 Nigeria
-
 North Macedonia
-
 Norway
-
 Oman
-
 Pakistan
-
 Palestine
-
 Panama
-
 Papua New Guinea
-
 Paraguay
-
 Peru
-
 Philippines
-
 Poland
-
 Portugal
-
 Puerto Rico
-
 Qatar
-
 Reunion
-
 Romania
-
 Rwanda
-
 Saudi Arabia
-
 Serbia
-
 Singapore
-
 Slovakia
-
 Slovenia
-
 Somalia
-
 South Africa
-
 Spain
-
 Sri Lanka
-
 Sweden
-
 Switzerland
-
 Syria
-
 Taiwan
-
 Tajikistan
-
 Tanzania
-
 Thailand
-
 Trinidad and Tobago
-
 Tunisia
-
 Turkey
-
 UAE
-
 Uganda
-
 Ukraine
-
 United Kingdom
-
United States
-
 Uruguay
-
 Uzbekistan
-
 Venezuela
-
 Vietnam
-
 Yemen
-
 Zambia
-
 Zimbabwe
- Forex
- Crypto












