

Home Depot pays $2.33 dividend: HD gains momentum

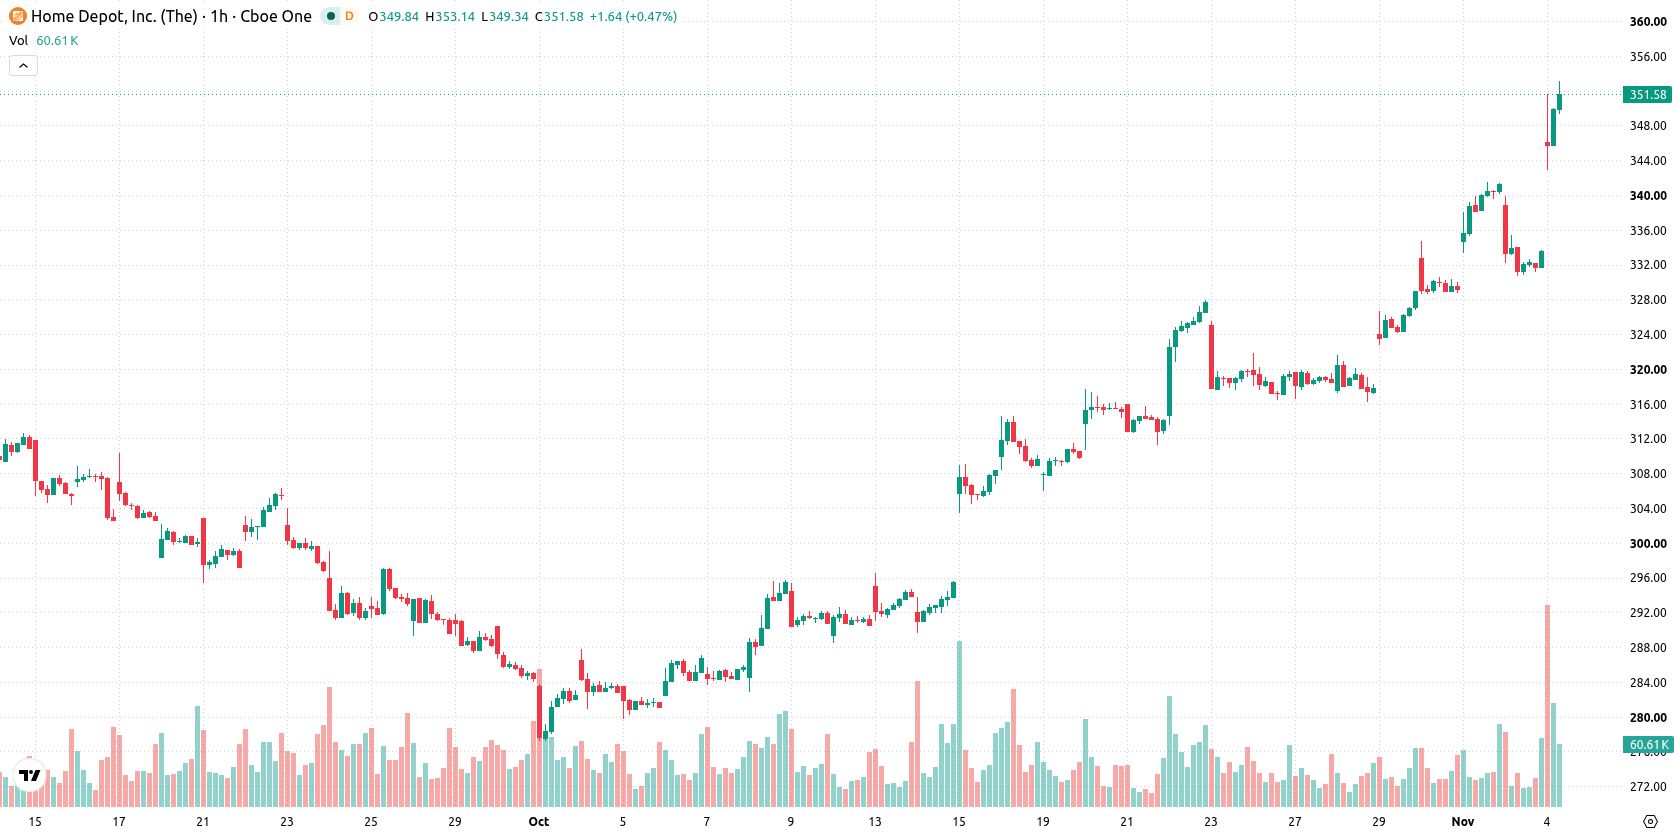
Home Depot (HD) stock is trading at $351.36, up 5.3% for the day and near its intraday high. The price is above its short-, medium-, and long-term moving averages, signaling strong momentum.
 339.17
349.73
Highlights
- Home Depot stock pays a quarterly dividend of $2.33 per share, yielding 2.7% annually on stable cash flows.
- The company maintains a payout ratio of 65.22%, indicating expectations for ongoing robust cash generation.
- Shares trade in a strong uptrend with buying momentum and are expected to consolidate between $343.2 and $359.52 short term.
Shareholder demand rises amid dividends and positive cash signals
Home Depot has delivered direct value to shareholders by paying a quarterly dividend of $2.33 per share, according to Defenseworld and TradingKey. The annualized dividend of $9.32 and a 2.7% yield reflect ongoing commitment to capital returns and signal the company's stable cash position. The payout ratio of 65.22% further indicates confidence in continued strong cash flows, reinforcing demand for HD shares during the current uptrend.
Overbought oscillators temper strong technical momentum and support
On the technical front, HD is positioned above its MA-20, MA-50, and MA-200 on the hourly chart, with the Ichimoku Kijun level at $337.87 serving as immediate support. MACD is producing a strong buy signal, and ADX indicates that buyers are currently in control. The RSI reading is in the overbought zone, closely mirrored by an overbought CCI, while Stoch RSI remains neutral and Awesome Oscillator is flat. Bull/Bear Power stands positive at 16.24, suggesting continued intraday buying strength, but caution is warranted given the divergence between strong demand and overbought oscillators.
Bullish bias likely as upside breakout risk outweighs downside
Over the next two to three trading days, HD is likely to trade within a typical volatility band between $343.2 and $359.52. The probability of an upward breakout is high, with more than an 80% chance of continued gains and less than a 20% likelihood of a downside move. In the baseline scenario, the price is expected to consolidate within this range, with bullish momentum prevailing unless support at $343.2 is decisively broken.
Earlier, analysts noted that Home Depot shares were supported by institutional accumulation and bullish technical momentum, while cautioning about potential resistance ahead. The current technical and dividend-led strength reinforces those bullish signals, with the key risk now being any loss of support at $343.20, which could shift the immediate outlook.






Latest Home Depot News




-
 Afghanistan
-
 Albania
-
 Algeria
-
 Angola
-
 Argentina
-
 Armenia
-
 Australia
-
 Austria
-
 Azerbaijan
-
 Bahamas
-
 Bahrain
-
 Bangladesh
-
 Belarus
-
 Belgium
-
 Bolivia
-
 Botswana
-
 Brazil
-
 Brunei
-
 Bulgaria
-
 Cambodia
-
 Cameroon
-
 Canada
-
 Chile
-
 China
-
 Colombia
-
 Congo
-
 Costa Rica
-
 Cote d'Ivoire
-
 Croatia
-
 Cuba
-
 Cyprus
-
 Czechia
-
 DR Congo
-
 Denmark
-
 Dominican Republic
-
 Ecuador
-
 Egypt
-
 El Salvador
-
 Estonia
-
 Eswatini
-
 Ethiopia
-
 Finland
-
 France
-
 Georgia
-
 Germany
-
 Ghana
-
 Greece
-
 Haiti
-
 Hong Kong
-
 Hungary
-
 India
-
 Indonesia
-
 Iran, Islamic republic
-
 Iraq
-
 Ireland
-
 Israel
-
 Italy
-
 Jamaica
-
 Japan
-
 Jordan
-
 Kazakhstan
-
 Kenya
-
 Korea
-
 Kuwait
-
 Kyrgyzstan
-
 Laos
-
 Latvia
-
 Lebanon
-
 Lesotho
-
 Libya
-
 Lithuania
-
 Luxembourg
-
 Madagascar
-
 Malaysia
-
 Malta
-
 Mauritius
-
 Mexico
-
 Moldova
-
 Mongolia
-
 Montenegro
-
 Morocco
-
 Mozambique
-
 Myanmar
-
 Namibia
-
 Nepal
-
 Netherlands
-
 New Zealand
-
 Nigeria
-
 North Macedonia
-
 Norway
-
 Oman
-
 Pakistan
-
 Palestine
-
 Panama
-
 Papua New Guinea
-
 Paraguay
-
 Peru
-
 Philippines
-
 Poland
-
 Portugal
-
 Puerto Rico
-
 Qatar
-
 Reunion
-
 Romania
-
 Rwanda
-
 Saudi Arabia
-
 Serbia
-
 Singapore
-
 Slovakia
-
 Slovenia
-
 Somalia
-
 South Africa
-
 Spain
-
 Sri Lanka
-
 Sweden
-
 Switzerland
-
 Syria
-
 Taiwan
-
 Tajikistan
-
 Tanzania
-
 Thailand
-
 Trinidad and Tobago
-
 Tunisia
-
 Turkey
-
 UAE
-
 Uganda
-
 Ukraine
-
 United Kingdom
-
United States
-
 Uruguay
-
 Uzbekistan
-
 Venezuela
-
 Vietnam
-
 Yemen
-
 Zambia
-
 Zimbabwe
- Forex
- Crypto












