

Home Depot stock weekly forecast: Bullish trend tests upside limits as price hits top of recent range

Shares of Home Depot, Inc (HD) are trading near $341 after gaining more than 3% over the past week, with the rally now encountering overbought technical conditions. A series of institutional moves and anticipation ahead of the upcoming quarterly earnings are likely to guide sentiment in the week ahead.
 349.71
355.35
Highlights
- Shares of Home Depot rose 3.63% over the past seven days, currently trading at $341.14 with a strong trend.
- The stock trades above key moving averages but technical indicators register overbought conditions and short-term overheating risk.
- Key support is at $334.11 and resistance at $341.51, with a projected range of $329.83 to $352.44 and high probability of further upside if support holds.
Earnings anticipation rises as institutional flows reshape sentiment this week
Home Depot has set its third-quarter earnings call for November 17, 2026, anchoring market attention for the week ahead, according to stocktitan.net. Recent SEC filings show that TSG Advice Partners LLC, Mirae Asset Global Investments Co. Ltd., and Americana Partners LLC all acquired new positions in HD during the third quarter, while ProShare Advisors LLC and Greenleaf Trust trimmed their holdings. These institutional moves and the scheduled earnings event are likely to shape trading activity and expectations for HD.
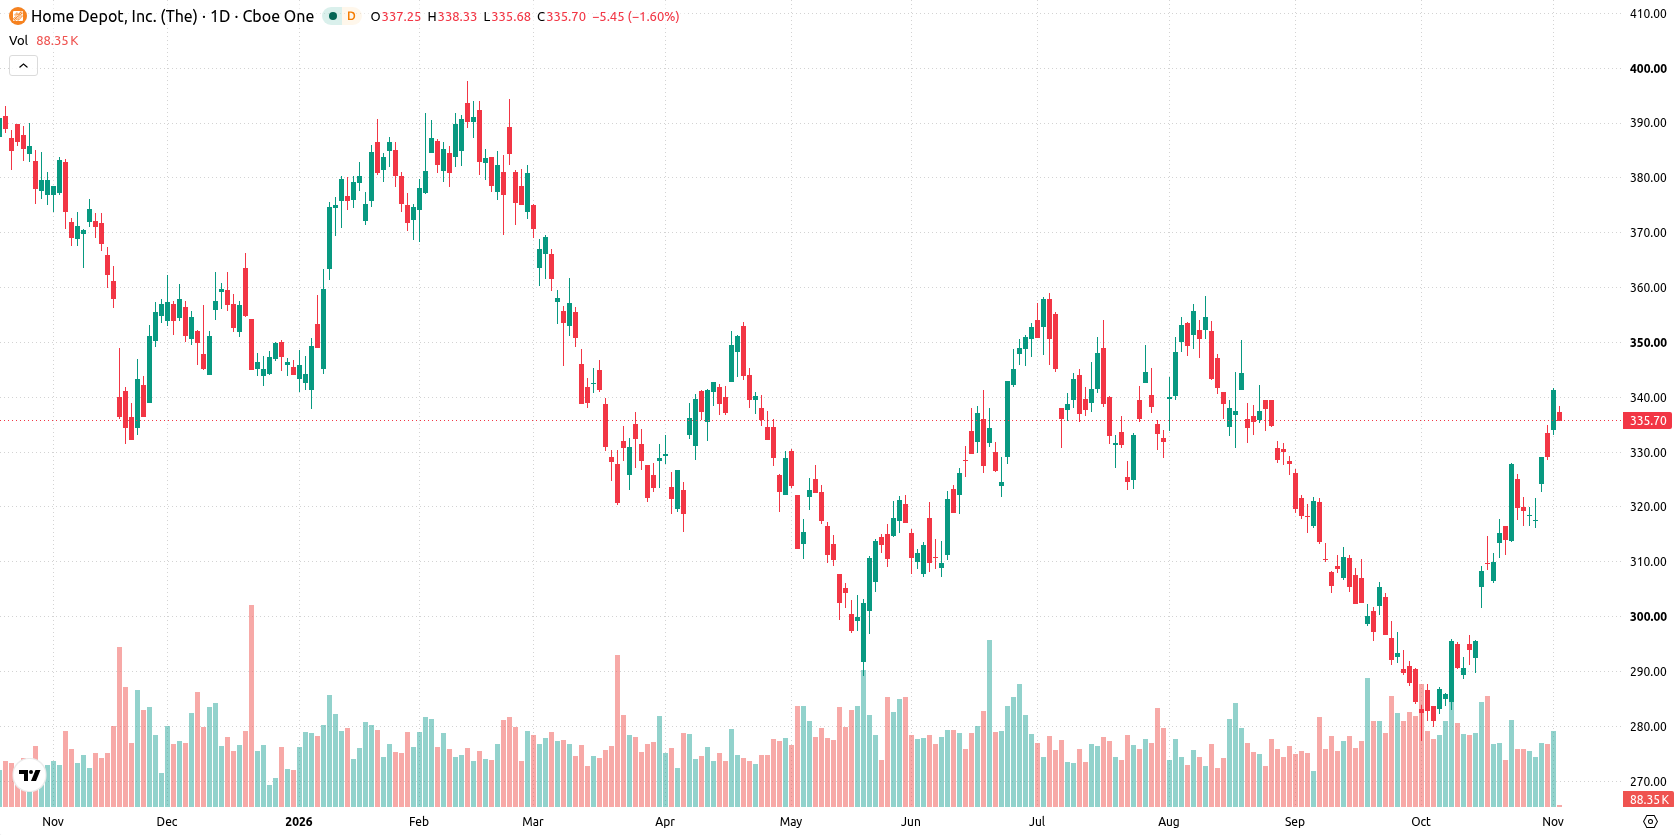
Overbought momentum signals risk of pullback as trend tests resistance
The daily chart shows a trending move, driven by a sustained move higher with a firm trend, as price pushes to the very top of this week’s range and volatility registered at 7.99%. However, both the RSI and the CCI are in overbought territory (RSI: 73.53, CCI: 146.94), which signals a risk of short-term overheating even as momentum readings like MACD remain on a buy footing. Immediate support sits at the MA-200 at $334.11, while resistance is at $341.51, the recent weekly high. The proximity to resistance increases the risk of a near-term stalling or pullback despite the bullish trend.
Bullish bias holds next week unless support fails near expected breakout zone
In the week ahead, the expected range is $329.83 to $352.44. There is a very high probability (more than 80%) of further upside, with a very low probability (less than 20%) of a decline. The base case favors consolidation or further gains as long as the price holds above $334.11. A breakout above $341.51 could open the way to the upper end of the expected range, while a drop below $334.11 would signal a shift to corrective action and threaten a move towards $329.83.
Earlier, analysts noted that Home Depot shares were supported by strong institutional accumulation and bullish technical momentum, while cautioning about potential resistance ahead. The latest positioning activity around the upcoming earnings call reinforces this outlook, with the key level to monitor now being the $341.51 resistance for any breakout-driven move toward the upper end of the projected range.









-
 Afghanistan
-
 Albania
-
 Algeria
-
 Angola
-
 Argentina
-
 Armenia
-
 Australia
-
 Austria
-
 Azerbaijan
-
 Bahamas
-
 Bahrain
-
 Bangladesh
-
 Belarus
-
 Belgium
-
 Bolivia
-
 Botswana
-
 Brazil
-
 Brunei
-
 Bulgaria
-
 Cambodia
-
 Cameroon
-
 Canada
-
 Chile
-
 China
-
 Colombia
-
 Congo
-
 Costa Rica
-
 Cote d'Ivoire
-
 Croatia
-
 Cuba
-
 Cyprus
-
 Czechia
-
 DR Congo
-
 Denmark
-
 Dominican Republic
-
 Ecuador
-
 Egypt
-
 El Salvador
-
 Estonia
-
 Eswatini
-
 Ethiopia
-
 Finland
-
 France
-
 Georgia
-
 Germany
-
 Ghana
-
 Greece
-
 Haiti
-
 Hong Kong
-
 Hungary
-
 India
-
 Indonesia
-
 Iran, Islamic republic
-
 Iraq
-
 Ireland
-
 Israel
-
 Italy
-
 Jamaica
-
 Japan
-
 Jordan
-
 Kazakhstan
-
 Kenya
-
 Korea
-
 Kuwait
-
 Kyrgyzstan
-
 Laos
-
 Latvia
-
 Lebanon
-
 Lesotho
-
 Libya
-
 Lithuania
-
 Luxembourg
-
 Madagascar
-
 Malaysia
-
 Malta
-
 Mauritius
-
 Mexico
-
 Moldova
-
 Mongolia
-
 Montenegro
-
 Morocco
-
 Mozambique
-
 Myanmar
-
 Namibia
-
 Nepal
-
 Netherlands
-
 New Zealand
-
 Nigeria
-
 North Macedonia
-
 Norway
-
 Oman
-
 Pakistan
-
 Palestine
-
 Panama
-
 Papua New Guinea
-
 Paraguay
-
 Peru
-
 Philippines
-
 Poland
-
 Portugal
-
 Puerto Rico
-
 Qatar
-
 Reunion
-
 Romania
-
 Rwanda
-
 Saudi Arabia
-
 Serbia
-
 Singapore
-
 Slovakia
-
 Slovenia
-
 Somalia
-
 South Africa
-
 Spain
-
 Sri Lanka
-
 Sweden
-
 Switzerland
-
 Syria
-
 Taiwan
-
 Tajikistan
-
 Tanzania
-
 Thailand
-
 Trinidad and Tobago
-
 Tunisia
-
 Turkey
-
 UAE
-
 Uganda
-
 Ukraine
-
 United Kingdom
-
United States
-
 Uruguay
-
 Uzbekistan
-
 Venezuela
-
 Vietnam
-
 Yemen
-
 Zambia
-
 Zimbabwe
- Forex
- Crypto












