

Verizon stock weekly forecast: Dividend hike and new growth drivers highlight backdrop as momentum stalls

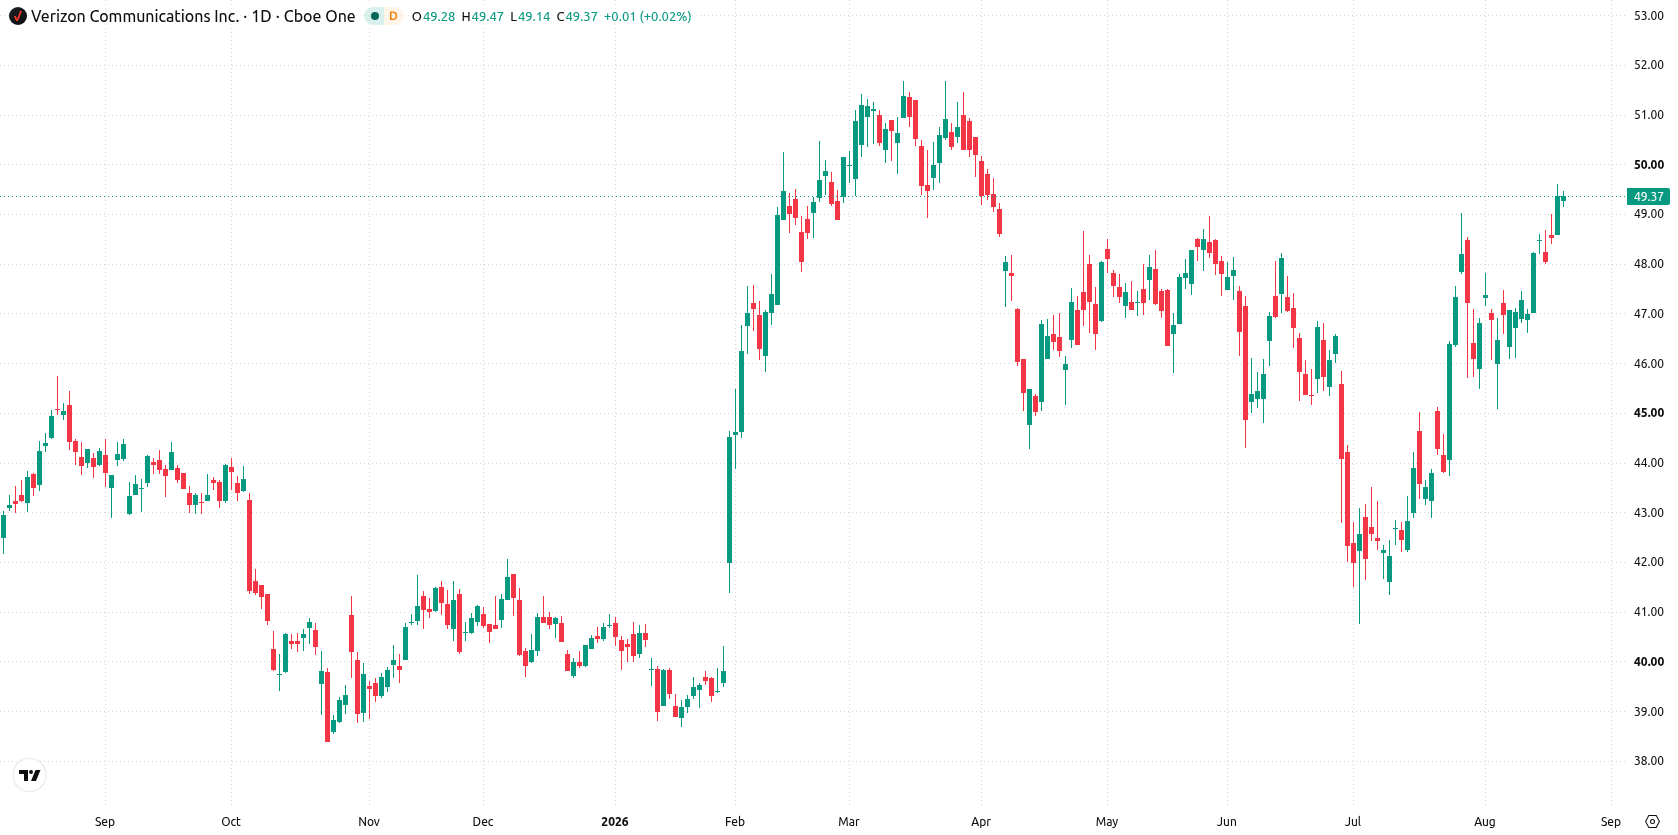
Shares of Verizon Communications Inc. (VZ) are trading near $49.4 after climbing nearly 2% over the past week, as a sharp rally brings the stock up against overbought technical conditions. With the recent surge losing steam, traders are weighing whether support will hold or if momentum can carry through resistance in the days ahead.
 45.25
45.32
Highlights
- Shares of Verizon rose 1.88% over the past week to $49.4, trading securely above key moving averages.
- The stock is consolidating just below resistance at $49.56 within a narrow range and shows signs of overbought momentum.
- Price is expected to trade between $48.7 and $51.07 in the week ahead, with low probability of a decline below $48.
Dividend hike and guidance upgrade underpin steady sentiment this week
Verizon increased its dividend for the 20th consecutive year in 2026, reinforcing its reputation for steady shareholder returns, according to Yahoo Finance and Insider Monkey. The company also raised its full-year adjusted guidance and expanded capital distribution, keeping dividends as its primary method of cash return, as noted by Yahoo Finance and Trefis. New growth drivers include a $1 billion fiber network agreement with Google to support AI connectivity, recent launch of the Pixel 11 lineup, and new bundled offerings, while ongoing initiatives in business services highlight continued efforts to offset revenue pressures and manage high debt levels ahead.
Overbought signals and flat trend as price hugs resistance
On the daily chart, Verizon stock is consolidating with price pinned to resistance at $49.56 in a contained move within a narrow range. Both CCI and Stochastic RSI are in the overbought zone, with CCI reading 171.14 and Stochastic RSI at 100, pointing to stretched momentum as volatility over the past week ran 3.25%. The MACD remains in a buy direction, but the ADX shows a flat trend, suggesting the potential for near-term exhaustion as resistance holds. Immediate support is at $48, with the Ichimoku Kijun reinforcing underlying demand at $45.89.
Upside breakout risk looms with consolidation likely in coming week
In the week ahead, the expected range is $48.7 to $51.07. There is a very high probability (more than 80%) of an upside move and a very low probability (less than 20%) of a decline. Base case is continued consolidation between $48 and $49.56 as momentum stays elevated. A sustained move above $49.56 would open the way to further gains toward $51.07, while a pullback below support at $48 would signal short-term weakness.
Earlier, analysts noted that Verizon’s upgraded guidance and expanded buyback program had reinforced a broadly bullish technical outlook. With recent developments highlighting ongoing consolidation beneath key resistance, traders should watch for a decisive break above $49.56 to confirm upward momentum or risk a short-term reversal if support at $48 fails.






Latest Verizon News



-
 Afghanistan
-
 Albania
-
 Algeria
-
 Angola
-
 Argentina
-
 Armenia
-
 Australia
-
 Austria
-
 Azerbaijan
-
 Bahamas
-
 Bahrain
-
 Bangladesh
-
 Belarus
-
 Belgium
-
 Bolivia
-
 Botswana
-
 Brazil
-
 Brunei
-
 Bulgaria
-
 Cambodia
-
 Cameroon
-
 Canada
-
 Chile
-
 China
-
 Colombia
-
 Congo
-
 Costa Rica
-
 Cote d'Ivoire
-
 Croatia
-
 Cuba
-
 Cyprus
-
 Czechia
-
 DR Congo
-
 Denmark
-
 Dominican Republic
-
 Ecuador
-
 Egypt
-
 El Salvador
-
 Estonia
-
 Eswatini
-
 Ethiopia
-
 Finland
-
 France
-
 Georgia
-
 Germany
-
 Ghana
-
 Greece
-
 Haiti
-
 Hong Kong
-
 Hungary
-
 India
-
 Indonesia
-
 Iran, Islamic republic
-
 Iraq
-
 Ireland
-
 Israel
-
 Italy
-
 Jamaica
-
 Japan
-
 Jordan
-
 Kazakhstan
-
 Kenya
-
 Korea
-
 Kuwait
-
 Kyrgyzstan
-
 Laos
-
 Latvia
-
 Lebanon
-
 Lesotho
-
 Libya
-
 Lithuania
-
 Luxembourg
-
 Madagascar
-
 Malaysia
-
 Malta
-
 Mauritius
-
 Mexico
-
 Moldova
-
 Mongolia
-
 Montenegro
-
 Morocco
-
 Mozambique
-
 Myanmar
-
 Namibia
-
 Nepal
-
 Netherlands
-
 New Zealand
-
 Nigeria
-
 North Macedonia
-
 Norway
-
 Oman
-
 Pakistan
-
 Palestine
-
 Panama
-
 Papua New Guinea
-
 Paraguay
-
 Peru
-
 Philippines
-
 Poland
-
 Portugal
-
 Puerto Rico
-
 Qatar
-
 Reunion
-
 Romania
-
 Rwanda
-
 Saudi Arabia
-
 Serbia
-
 Singapore
-
 Slovakia
-
 Slovenia
-
 Somalia
-
 South Africa
-
 Spain
-
 Sri Lanka
-
 Sweden
-
 Switzerland
-
 Syria
-
 Taiwan
-
 Tajikistan
-
 Tanzania
-
 Thailand
-
 Trinidad and Tobago
-
 Tunisia
-
 Turkey
-
 UAE
-
 Uganda
-
 Ukraine
-
 United Kingdom
-
United States
-
 Uruguay
-
 Uzbekistan
-
 Venezuela
-
 Vietnam
-
 Yemen
-
 Zambia
-
 Zimbabwe
- Forex
- Crypto












