

LULU slides over 3% as stock trades below major moving averages, reflecting seller pressure

Lululemon Athletica Inc. (LULU) fell 3.37% after a series of key executive departures, led by Chief Communications Officer Bill Chandler's exit ahead of new CEO Heidi O’Neill's arrival. The downside is reinforced by the stock trading below all major moving averages, confirming broad-based seller pressure.
 111.62
Highlights
- Lululemon experienced a third recent executive exit as the chief communications officer departed before the new CEO assumes the role.
- The company expanded its Like New resale program into Canada, launching operations from a new Calgary facility.
- Shares of Lululemon fell 3.37% to $115.43, trading below key moving averages with a projected range of $110.71 to $119.
Leadership exits compound uncertainty amid expansion and results timeline
Lululemon experienced multiple executive departures, including Chief Communications Officer Bill Chandler before incoming CEO Heidi O’Neill assumes her role. This marks the third recent exit from its leadership team, coming after its chief AI and technology officer also left. The company is also expanding its 'Like New' resale program into Canada, with operations now managed through a new Calgary hub, and it plans to release second quarter fiscal 2026 results on September 3, 2026.
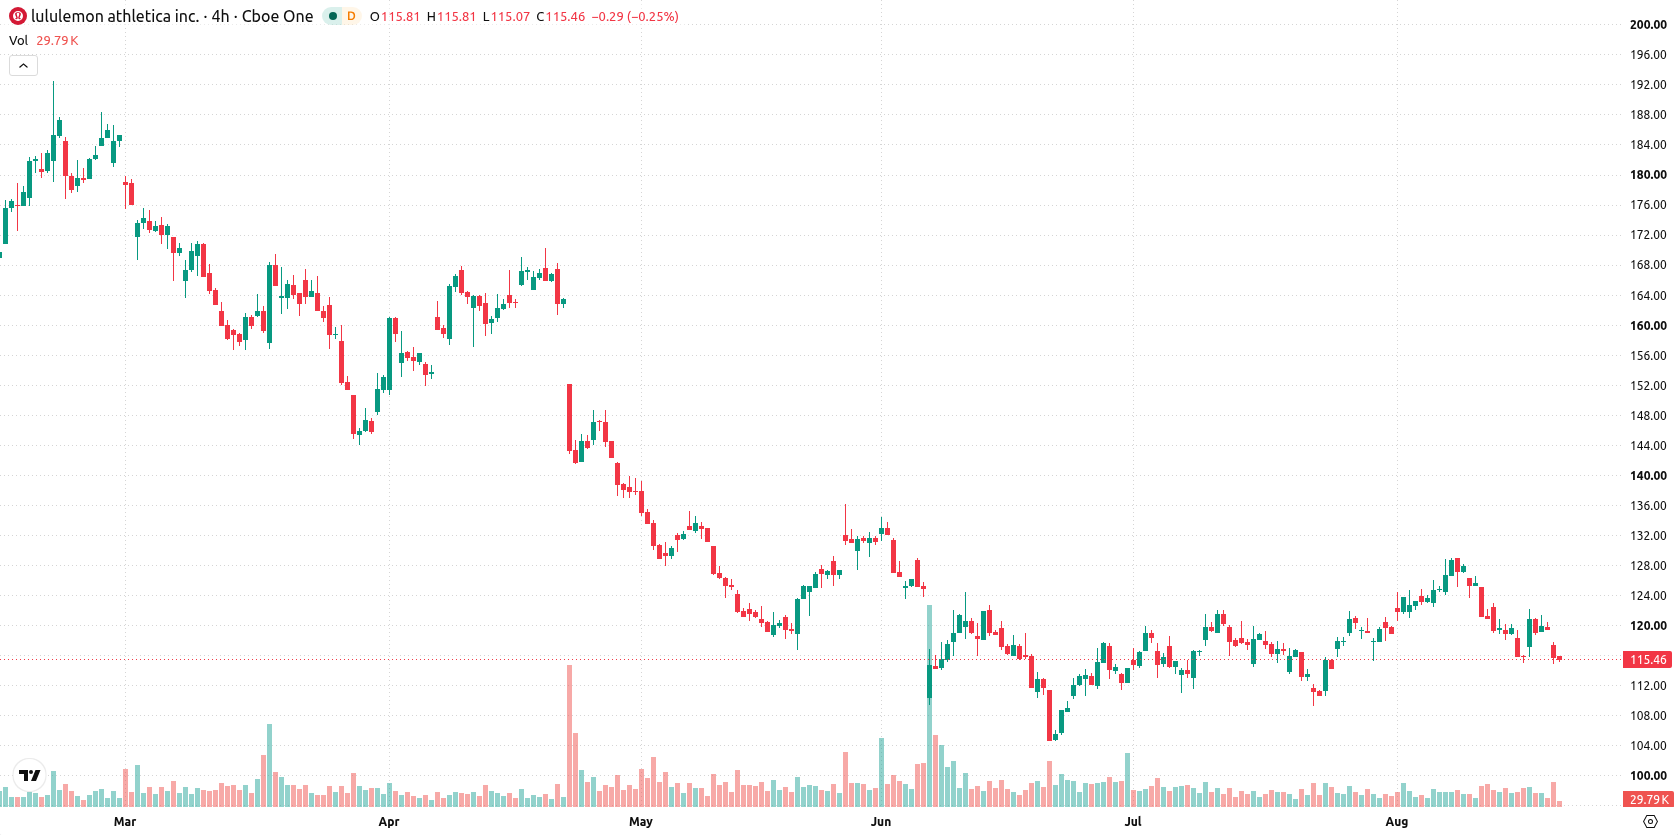
Bearish long-term trend confirmed as momentum signals diverge
Lululemon is trading below its short-term ($120.58, MA-20), medium-term ($117.7, MA-50), and long-term ($155.76, MA-200) moving averages, signaling persistent seller pressure across all time frames. The long-term bearish trend is confirmed by the alignment of the MA-50 below the MA-200. Nearest support is at $114.91, and resistance lies at $117.7. Momentum signals are mixed: the MACD issues a 'Strong Buy' signal, indicating some emerging bullish momentum, while the ADX at 10.66 confirms weak overall trend strength. The RSI stands at 48.76 with a 'Sell' outlook, suggesting sellers are gaining an advantage but not yet in oversold territory. Stochastic RSI at 28.58 and CCI at -10.65 indicate neutral momentum, and Bull/Bear Power (BBP) at 0.78 suggests buyers have a slight edge intraday, although flagged as overbought. LULU last traded at $115.43, near session lows, after opening with a downside gap and seeing intraday volatility at 2.54%, with oscillators and momentum indicators diverging and highlighting a lack of clear direction.
Earlier, analysts noted that Lululemon continued to face persistent long-term bearish pressure amid North American sales weakness and uncertainty in its leadership team. The latest wave of executive departures reinforces ongoing downside risk, making the $114.91 support level a critical threshold for traders to monitor in the coming sessions.






Latest Lululemon Athletica News





-
 Afghanistan
-
 Albania
-
 Algeria
-
 Angola
-
 Argentina
-
 Armenia
-
 Australia
-
 Austria
-
 Azerbaijan
-
 Bahamas
-
 Bahrain
-
 Bangladesh
-
 Belarus
-
 Belgium
-
 Bolivia
-
 Botswana
-
 Brazil
-
 Brunei
-
 Bulgaria
-
 Cambodia
-
 Cameroon
-
 Canada
-
 Chile
-
 China
-
 Colombia
-
 Congo
-
 Costa Rica
-
 Cote d'Ivoire
-
 Croatia
-
 Cuba
-
 Cyprus
-
 Czechia
-
 DR Congo
-
 Denmark
-
 Dominican Republic
-
 Ecuador
-
 Egypt
-
 El Salvador
-
 Estonia
-
 Eswatini
-
 Ethiopia
-
 Finland
-
 France
-
 Georgia
-
 Germany
-
 Ghana
-
 Greece
-
 Haiti
-
 Hong Kong
-
 Hungary
-
 India
-
 Indonesia
-
 Iran, Islamic republic
-
 Iraq
-
 Ireland
-
 Israel
-
 Italy
-
 Jamaica
-
 Japan
-
 Jordan
-
 Kazakhstan
-
 Kenya
-
 Korea
-
 Kuwait
-
 Kyrgyzstan
-
 Laos
-
 Latvia
-
 Lebanon
-
 Lesotho
-
 Libya
-
 Lithuania
-
 Luxembourg
-
 Madagascar
-
 Malaysia
-
 Malta
-
 Mauritius
-
 Mexico
-
 Moldova
-
 Mongolia
-
 Montenegro
-
 Morocco
-
 Mozambique
-
 Myanmar
-
 Namibia
-
 Nepal
-
 Netherlands
-
 New Zealand
-
 Nigeria
-
 North Macedonia
-
 Norway
-
 Oman
-
 Pakistan
-
 Palestine
-
 Panama
-
 Papua New Guinea
-
 Paraguay
-
 Peru
-
 Philippines
-
 Poland
-
 Portugal
-
 Puerto Rico
-
 Qatar
-
 Reunion
-
 Romania
-
 Rwanda
-
 Saudi Arabia
-
 Serbia
-
 Singapore
-
 Slovakia
-
 Slovenia
-
 Somalia
-
 South Africa
-
 Spain
-
 Sri Lanka
-
 Sweden
-
 Switzerland
-
 Syria
-
 Taiwan
-
 Tajikistan
-
 Tanzania
-
 Thailand
-
 Trinidad and Tobago
-
 Tunisia
-
 Turkey
-
 UAE
-
 Uganda
-
 Ukraine
-
 United Kingdom
-
United States
-
 Uruguay
-
 Uzbekistan
-
 Venezuela
-
 Vietnam
-
 Yemen
-
 Zambia
-
 Zimbabwe
- Forex
- Crypto












