

LULU slides around 3.5% as bearish trend deepens on disappointing sales outlook

Lululemon Athletica (LULU) dropped 3.47% after renewed concerns over the company's fiscal 2026 outlook and continued weakness in North American sales triggered fresh selling. The decline is supported by the stock's ongoing alignment below its 200-day moving average, reinforcing a longer-term bearish trend.
 110.56
112.76
Highlights
- Lululemon reported declining North American sales and sustained pressure on its fiscal 2026 outlook, with analysts projecting a significant decrease in earnings per share.
- Chief Strategy Officer Rachel Acheson departed several weeks before new CEO Heidi ONeill arrives, as international markets like China partially offset weakness in the Americas segment.
- Lululemon stock trades well below its 200-day average with mixed momentum signals, expecting to fluctuate between $117.83 and $124.67 over the next five days.
Profit outlook dims amid leadership change and international offset
Lululemon reported sustained pressure on its fiscal 2026 outlook along with declining North American sales. Analysts expect a significant year-over-year decrease in earnings per share. Chief Strategy Officer Rachel Acheson has exited the company several weeks ahead of CEO Heidi O’Neill’s arrival. International markets, especially China, have partially offset weakness in the Americas segment, though price action has remained under broader selling pressure.
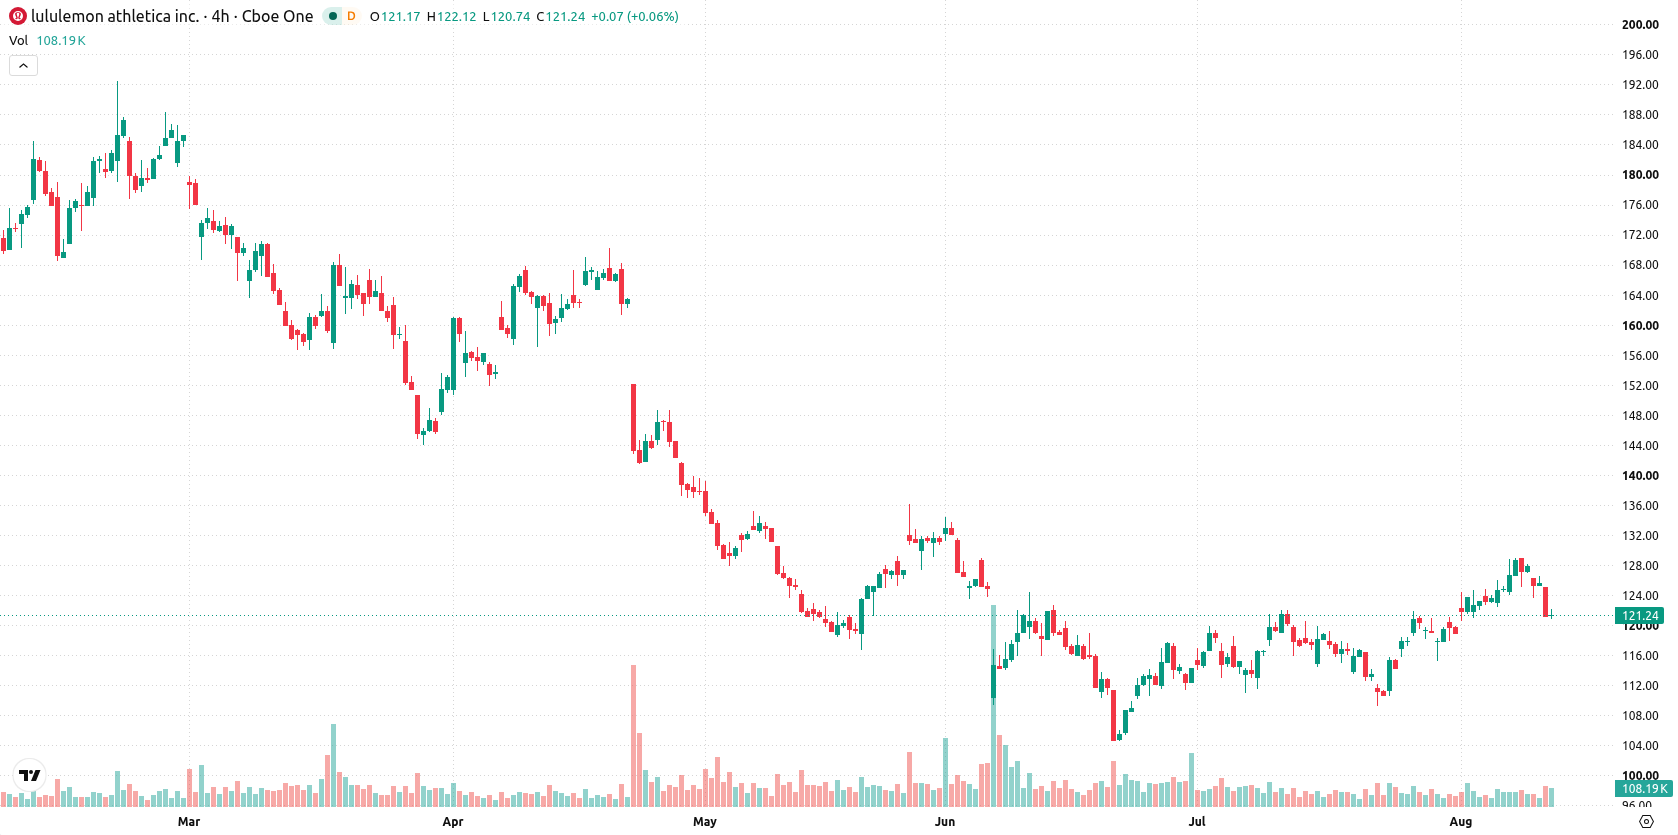
Short-term buying contested by mixed momentum and overbought signals
Lululemon is trading above its 20-day and 50-day moving averages at $119.83 and $118.24, indicating ongoing short- and medium-term buying interest. The stock remains well below the 200-day moving average at $157.48, confirming longer-term bearish alignment, with immediate support at $121.01 and near-term resistance at $122.01. Momentum signals are mixed: the Moving Average Convergence Divergence (MACD) suggests upward momentum, while the Average Directional Index (ADX) indicates a weak trend. The Relative Strength Index (RSI) is neutral-bullish but not overbought, the Stochastic RSI is also neutral, and the Commodity Channel Index (CCI) flags mild overbought conditions. Bull/Bear Power (BBP) shows buyers dominate intraday, yet this is paired with an overbought warning. After a downside gap of about $1.18 (-0.94%) at the open, the stock is down $4.36 or 3.47% and trades near the session low, with intraday volatility at 3.18%. This weakness after the open coincides with conflicting momentum and overbought signals.
Earlier, analysts noted that taking a public company private can reduce market transparency and increase risks for investors and lenders following significant changes to ownership structure. In Lululemon's case, while the company remains publicly traded, traders should monitor the $124.67 resistance and $117.83 support in the coming days for indications of any sustained shift in directional momentum.






Latest Lululemon Athletica News





-
 Afghanistan
-
 Albania
-
 Algeria
-
 Angola
-
 Argentina
-
 Armenia
-
 Australia
-
 Austria
-
 Azerbaijan
-
 Bahamas
-
 Bahrain
-
 Bangladesh
-
 Belarus
-
 Belgium
-
 Bolivia
-
 Botswana
-
 Brazil
-
 Brunei
-
 Bulgaria
-
 Cambodia
-
 Cameroon
-
 Canada
-
 Chile
-
 China
-
 Colombia
-
 Congo
-
 Costa Rica
-
 Cote d'Ivoire
-
 Croatia
-
 Cuba
-
 Cyprus
-
 Czechia
-
 DR Congo
-
 Denmark
-
 Dominican Republic
-
 Ecuador
-
 Egypt
-
 El Salvador
-
 Estonia
-
 Eswatini
-
 Ethiopia
-
 Finland
-
 France
-
 Georgia
-
 Germany
-
 Ghana
-
 Greece
-
 Haiti
-
 Hong Kong
-
 Hungary
-
 India
-
 Indonesia
-
 Iran, Islamic republic
-
 Iraq
-
 Ireland
-
 Israel
-
 Italy
-
 Jamaica
-
 Japan
-
 Jordan
-
 Kazakhstan
-
 Kenya
-
 Korea
-
 Kuwait
-
 Kyrgyzstan
-
 Laos
-
 Latvia
-
 Lebanon
-
 Lesotho
-
 Libya
-
 Lithuania
-
 Luxembourg
-
 Madagascar
-
 Malaysia
-
 Malta
-
 Mauritius
-
 Mexico
-
 Moldova
-
 Mongolia
-
 Montenegro
-
 Morocco
-
 Mozambique
-
 Myanmar
-
 Namibia
-
 Nepal
-
 Netherlands
-
 New Zealand
-
 Nigeria
-
 North Macedonia
-
 Norway
-
 Oman
-
 Pakistan
-
 Palestine
-
 Panama
-
 Papua New Guinea
-
 Paraguay
-
 Peru
-
 Philippines
-
 Poland
-
 Portugal
-
 Puerto Rico
-
 Qatar
-
 Reunion
-
 Romania
-
 Rwanda
-
 Saudi Arabia
-
 Serbia
-
 Singapore
-
 Slovakia
-
 Slovenia
-
 Somalia
-
 South Africa
-
 Spain
-
 Sri Lanka
-
 Sweden
-
 Switzerland
-
 Syria
-
 Taiwan
-
 Tajikistan
-
 Tanzania
-
 Thailand
-
 Trinidad and Tobago
-
 Tunisia
-
 Turkey
-
 UAE
-
 Uganda
-
 Ukraine
-
 United Kingdom
-
United States
-
 Uruguay
-
 Uzbekistan
-
 Venezuela
-
 Vietnam
-
 Yemen
-
 Zambia
-
 Zimbabwe
- Forex
- Crypto












