


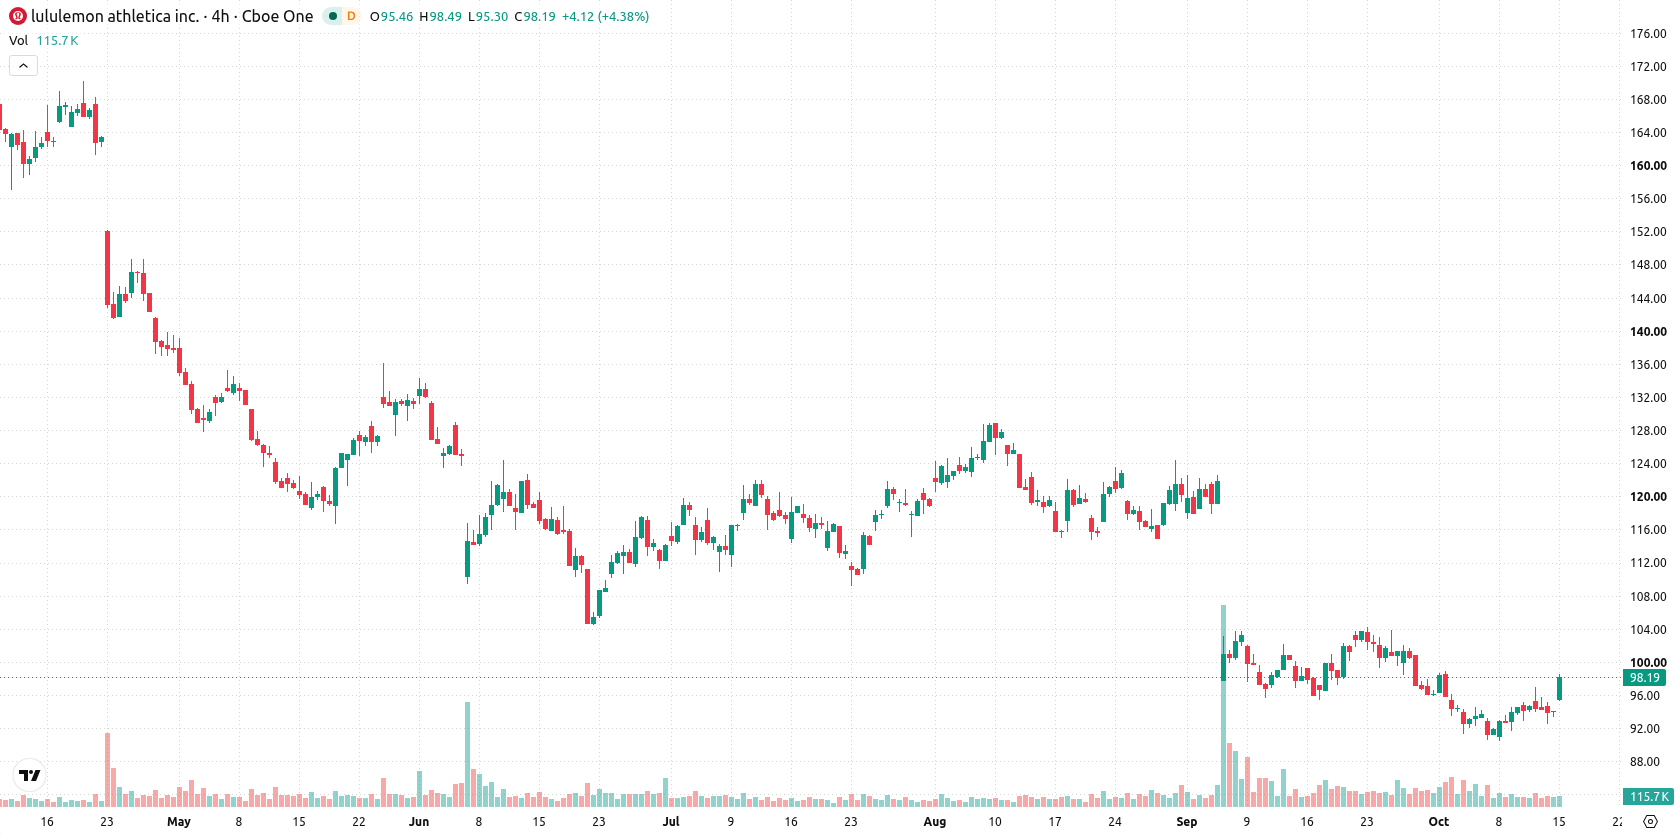
Lululemon Athletica Inc. (LULU) jumped 4.48% after a steep drop, as investors reacted to news of substantial management and operational changes following poor earnings and lingering product quality complaints. The rebound looks limited, with Lululemon still trading below its 50-day and 200-day moving averages, indicating continued medium- and long-term selling pressure.
 100.67
100.40
100.67
100.40
Highlights
- Lululemon stock declined sharply after a 4.3% year-over-year revenue drop, a 10% decline in same-store sales, and a 20% fall in key product categories.
- Recent operational turmoil includes an ongoing securities fraud investigation, layoff of fabric team members, temporary online sales suspension for some items, and management restructuring led by new CEO Heidi O'Neill.
- Technical indicators show prevailing seller dominance and oversold conditions, with the stock expected to consolidate between $94.07 and $100.48 over the next five sessions.
Investigation and executive reshuffle intensify after revenue setbacks
Lululemon experienced a significant decline in its stock price after reporting a 4.3% year-over-year revenue decrease in the second quarter, along with a 10% fall in same-store sales and a 20% drop in key product categories such as leggings and women’s tops. The company is under investigation for potential securities fraud by leading law firms tied to these financial results and the sharp stock drop. Operational changes have included the layoff of seven employees from the fabric development team following quality complaints, a temporary halt to online sales for some collections, and a companywide management reshuffle, including the appointment of new CEO Heidi O'Neill and updated executive roles focused on product and operational improvements.
Short-term support holds as broader technicals flag persistent weakness
Lululemon is currently trading above its 20-day moving average at $96.96, but remains below both the 50-day and 200-day moving averages at $107.74 and $140.27, respectively. This setup points to short-term support but persistent selling pressure over longer periods, with resistance at $100.48 and support near $97.18. Momentum indicators are predominantly negative, as both the MACD and ADX suggest a strong sell bias. The RSI, CCI, and BBP reinforce this, indicating prevailing seller dominance and oversold conditions. The Stochastic RSI and Awesome Oscillator are both neutral. Today's price is near the session high, and intraday volatility sits at 2.58%. This upward move stands in contrast to the generally bearish momentum signals.
Earlier, analysts noted that Lululemon’s SKU reduction strategy was aimed at improving operating efficiency and profitability amid persistent margin pressures. With ongoing management changes and operational adjustments now underway, traders should monitor whether the stock can hold support near $97.18 as the next move could be shaped by both execution risks and potential downside volatility.





Latest Lululemon Athletica News






-
 Afghanistan
-
 Albania
-
 Algeria
-
 Angola
-
 Argentina
-
 Armenia
-
 Australia
-
 Austria
-
 Azerbaijan
-
 Bahamas
-
 Bahrain
-
 Bangladesh
-
 Belarus
-
 Belgium
-
 Bolivia
-
 Botswana
-
 Brazil
-
 Brunei
-
 Bulgaria
-
 Cambodia
-
 Cameroon
-
 Canada
-
 Chile
Chile
-
 China
China
-
 Colombia
-
 Congo
Congo
-
 Costa Rica
-
 Cote d'Ivoire
-
 Croatia
-
 Cuba
Cuba
-
 Cyprus
-
 Czechia
-
 DR Congo
-
 Denmark
-
 Dominican Republic
-
 Ecuador
-
 Egypt
Egypt
-
 El Salvador
-
 Estonia
-
 Eswatini
-
 Ethiopia
-
 Finland
-
 France
-
 Georgia
-
 Germany
-
 Ghana
Ghana
-
 Greece
-
 Haiti
Haiti
-
 Hong Kong
-
 Hungary
-
 India
India
-
 Indonesia
-
 Iran, Islamic republic
-
 Iraq
Iraq
-
 Ireland
-
 Israel
-
 Italy
Italy
-
 Jamaica
-
 Japan
Japan
-
 Jordan
-
 Kazakhstan
-
 Kenya
Kenya
-
 Korea
Korea
-
 Kuwait
-
 Kyrgyzstan
-
 Laos
Laos
-
 Latvia
-
 Lebanon
-
 Lesotho
-
 Libya
Libya
-
 Lithuania
-
 Luxembourg
-
 Madagascar
-
 Malaysia
-
 Malta
Malta
-
 Mauritius
-
 Mexico
-
 Moldova
-
 Mongolia
-
 Montenegro
-
 Morocco
-
 Mozambique
-
 Myanmar
-
 Namibia
-
 Nepal
Nepal
-
 Netherlands
-
 New Zealand
-
 Nigeria
-
 North Macedonia
-
 Norway
-
 Oman
Oman
-
 Pakistan
-
 Palestine
-
 Panama
-
 Papua New Guinea
-
 Paraguay
-
 Peru
Peru
-
 Philippines
-
 Poland
-
 Portugal
-
 Puerto Rico
-
 Qatar
Qatar
-
 Reunion
-
 Romania
-
 Rwanda
-
 Saudi Arabia
-
 Serbia
-
 Singapore
-
 Slovakia
-
 Slovenia
-
 Somalia
-
 South Africa
-
 Spain
Spain
-
 Sri Lanka
-
 Sweden
-
 Switzerland
-
 Syria
Syria
-
 Taiwan
-
 Tajikistan
-
 Tanzania
-
 Thailand
-
 Trinidad and Tobago
-
 Tunisia
-
 Turkey
-
 UAE
UAE
-
 Uganda
-
 Ukraine
-
 United Kingdom
-
United States
-
 Uruguay
-
 Uzbekistan
-
 Venezuela
-
 Vietnam
-
 Yemen
Yemen
-
 Zambia
-
 Zimbabwe
- Forex
- Crypto












