

What's behind Lululemon Athletica's latest 3.1% stock pullback?

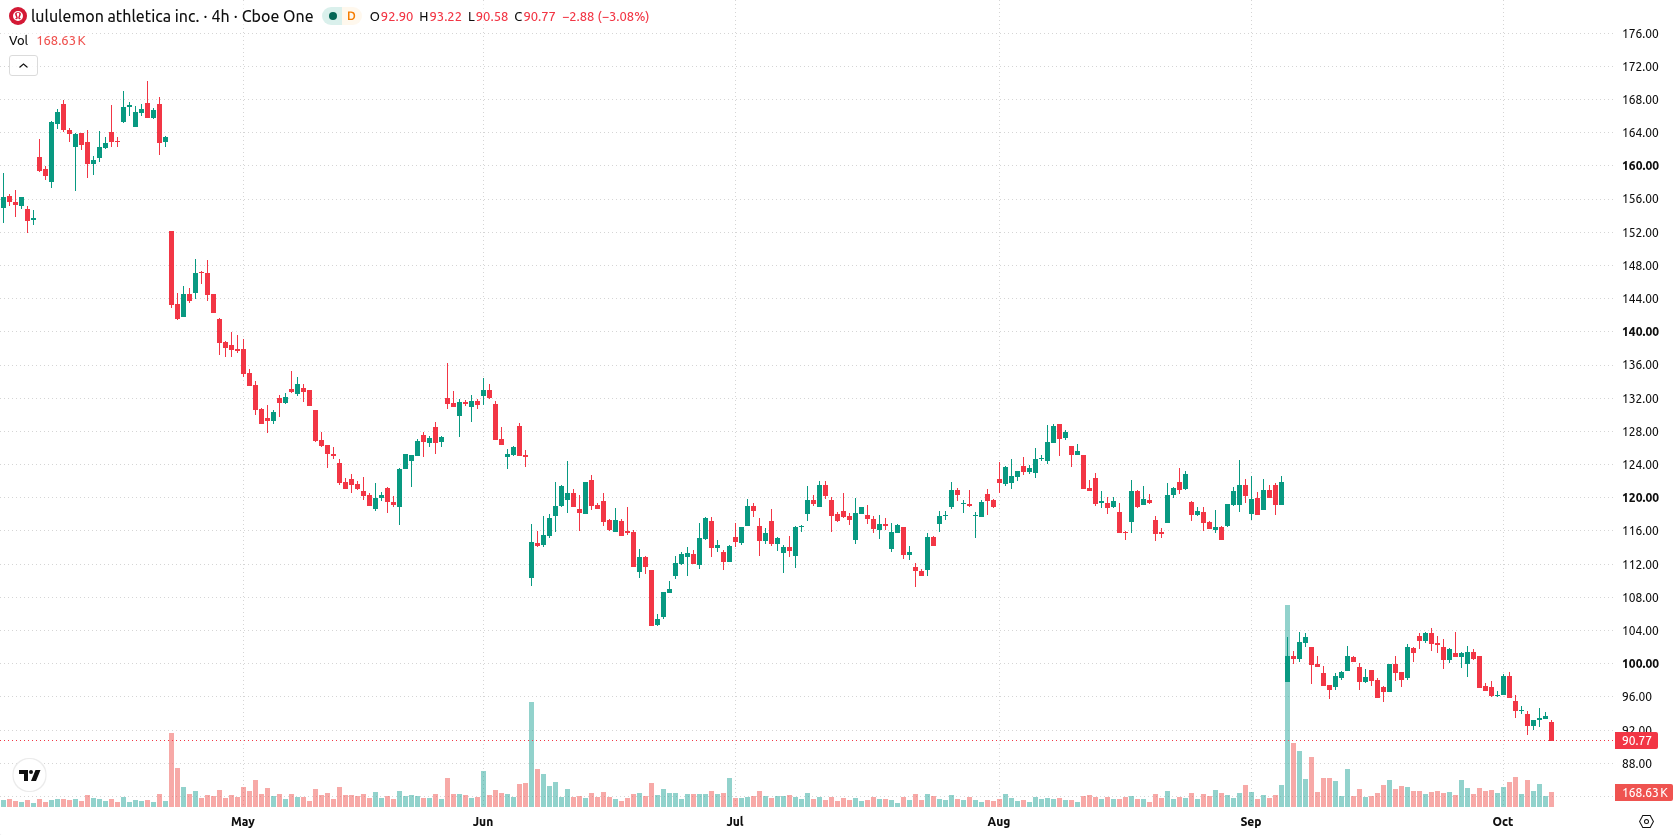
Lululemon Athletica Inc. (LULU) fell 3.1% today after management issued sharply reduced full-year earnings and revenue guidance, with Q2 2026 results showing a significant decline in North American sales and profitability. The drop is supported by bearish technical factors, as the stock remains below its major moving averages and faces continued selling pressure.
 111.62
Highlights
- Lululemon Athletica lowered its revenue and earnings forecasts for the year as comparable North American sales fell 12%.
- Operating margin dropped sharply from 21% to 12%, with investors initiating legal action over financial disclosures.
- Lululemon Athletica stock trades below key moving averages as technical indicators signal a bearish trend and an oversold condition, with price expected between $86.95 to $94.54 over the next 5 trading days.
Legal pressure mounts as North America losses widen and margins shrink
Lululemon Athletica reported disappointing Q2 2026 results, including lowered revenue and earnings forecasts for the upcoming year and a 12% decrease in comparable North American sales. The company also recorded a decline in operating margin from 21% to 12%, leading to legal action from some investors regarding financial disclosures. Secondary developments included the launch of a new Fall 2026 outerwear collection and a co-branded apparel initiative with Taylor’s University.
Bearish momentum builds as oversold signals reinforce support risks
Lululemon Athletica is trading below its 20-day ($98.35), 50-day ($110.99), and 200-day ($143.80) moving averages, signaling sustained pressure from sellers across all time frames. The nearest resistance is at $91.35, while support develops at $86.95. The medium- and long-term trends remain bearish, confirmed by the downward alignment of the 50-day and 200-day averages. Momentum indicators such as MACD and ADX show a negative bias, and the RSI, Stochastic RSI, and CCI all point to oversold conditions. Bull/Bear Power (BBP) indicates that sellers dominate intraday action, with an oversold forecast, and the Awesome Oscillator continues to signal a prevailing downtrend.
Previously it was reported that Frasers Group continued its strategy of acquiring stakes in underperforming retail brands with a significant investment in Under Armour. Lululemon's recent earnings disappointment and technical deterioration add another example of sector-wide pressure, highlighting $86.95 as a critical downside level for traders monitoring for a potential break and extended move lower.






Latest Lululemon Athletica News





-
 Afghanistan
-
 Albania
-
 Algeria
-
 Angola
-
 Argentina
-
 Armenia
-
 Australia
-
 Austria
-
 Azerbaijan
-
 Bahamas
-
 Bahrain
-
 Bangladesh
-
 Belarus
-
 Belgium
-
 Bolivia
-
 Botswana
-
 Brazil
-
 Brunei
-
 Bulgaria
-
 Cambodia
-
 Cameroon
-
 Canada
-
 Chile
-
 China
-
 Colombia
-
 Congo
-
 Costa Rica
-
 Cote d'Ivoire
-
 Croatia
-
 Cuba
-
 Cyprus
-
 Czechia
-
 DR Congo
-
 Denmark
-
 Dominican Republic
-
 Ecuador
-
 Egypt
-
 El Salvador
-
 Estonia
-
 Eswatini
-
 Ethiopia
-
 Finland
-
 France
-
 Georgia
-
 Germany
-
 Ghana
-
 Greece
-
 Haiti
-
 Hong Kong
-
 Hungary
-
 India
-
 Indonesia
-
 Iran, Islamic republic
-
 Iraq
-
 Ireland
-
 Israel
-
 Italy
-
 Jamaica
-
 Japan
-
 Jordan
-
 Kazakhstan
-
 Kenya
-
 Korea
-
 Kuwait
-
 Kyrgyzstan
-
 Laos
-
 Latvia
-
 Lebanon
-
 Lesotho
-
 Libya
-
 Lithuania
-
 Luxembourg
-
 Madagascar
-
 Malaysia
-
 Malta
-
 Mauritius
-
 Mexico
-
 Moldova
-
 Mongolia
-
 Montenegro
-
 Morocco
-
 Mozambique
-
 Myanmar
-
 Namibia
-
 Nepal
-
 Netherlands
-
 New Zealand
-
 Nigeria
-
 North Macedonia
-
 Norway
-
 Oman
-
 Pakistan
-
 Palestine
-
 Panama
-
 Papua New Guinea
-
 Paraguay
-
 Peru
-
 Philippines
-
 Poland
-
 Portugal
-
 Puerto Rico
-
 Qatar
-
 Reunion
-
 Romania
-
 Rwanda
-
 Saudi Arabia
-
 Serbia
-
 Singapore
-
 Slovakia
-
 Slovenia
-
 Somalia
-
 South Africa
-
 Spain
-
 Sri Lanka
-
 Sweden
-
 Switzerland
-
 Syria
-
 Taiwan
-
 Tajikistan
-
 Tanzania
-
 Thailand
-
 Trinidad and Tobago
-
 Tunisia
-
 Turkey
-
 UAE
-
 Uganda
-
 Ukraine
-
 United Kingdom
-
United States
-
 Uruguay
-
 Uzbekistan
-
 Venezuela
-
 Vietnam
-
 Yemen
-
 Zambia
-
 Zimbabwe
- Forex
- Crypto












