

Why is AST SpaceMobile stock down today? Q2 earnings miss and $59.89 support in focus

AST SpaceMobile (ASTS) stock is trading at $65.06 after declining 2.06% today. The price is currently positioned below its key moving averages on all timeframes.
 38.68
44.82
Highlights
- AST SpaceMobile reported a second quarter earnings miss, indicating weaker recent financial performance.
- The company received commercial FCC authorization to operate SpaceMobile across the US with plans for up to 248 satellites and advanced production now at 42 satellites.
- Shares of AST SpaceMobile fell 2.06% to $65.06 with strong bearish signals across all major indicators, and the projected trading range is $59.89 to $70.23 with a 60% downside probability in the near term.
Cautious investor sentiment persists despite FCC approvals and satellite expansion
AST SpaceMobile reported a Q2 earnings miss, which contributed to cautious investor sentiment by highlighting weaker financial momentum, according to MarketBeat. The company's operational progress continued as it received a 30-day FCC authorization to test 800 MHz satellite connectivity, setting the stage for further technology validation. Additionally, AST SpaceMobile secured commercial FCC authorization to operate its SpaceMobile service across the United States, covering up to 248 satellites, and increased the number of satellites in advanced production to 42, with ongoing expansion plans, Finance Yahoo reported. Despite these operational milestones, price action has remained under broader selling pressure.
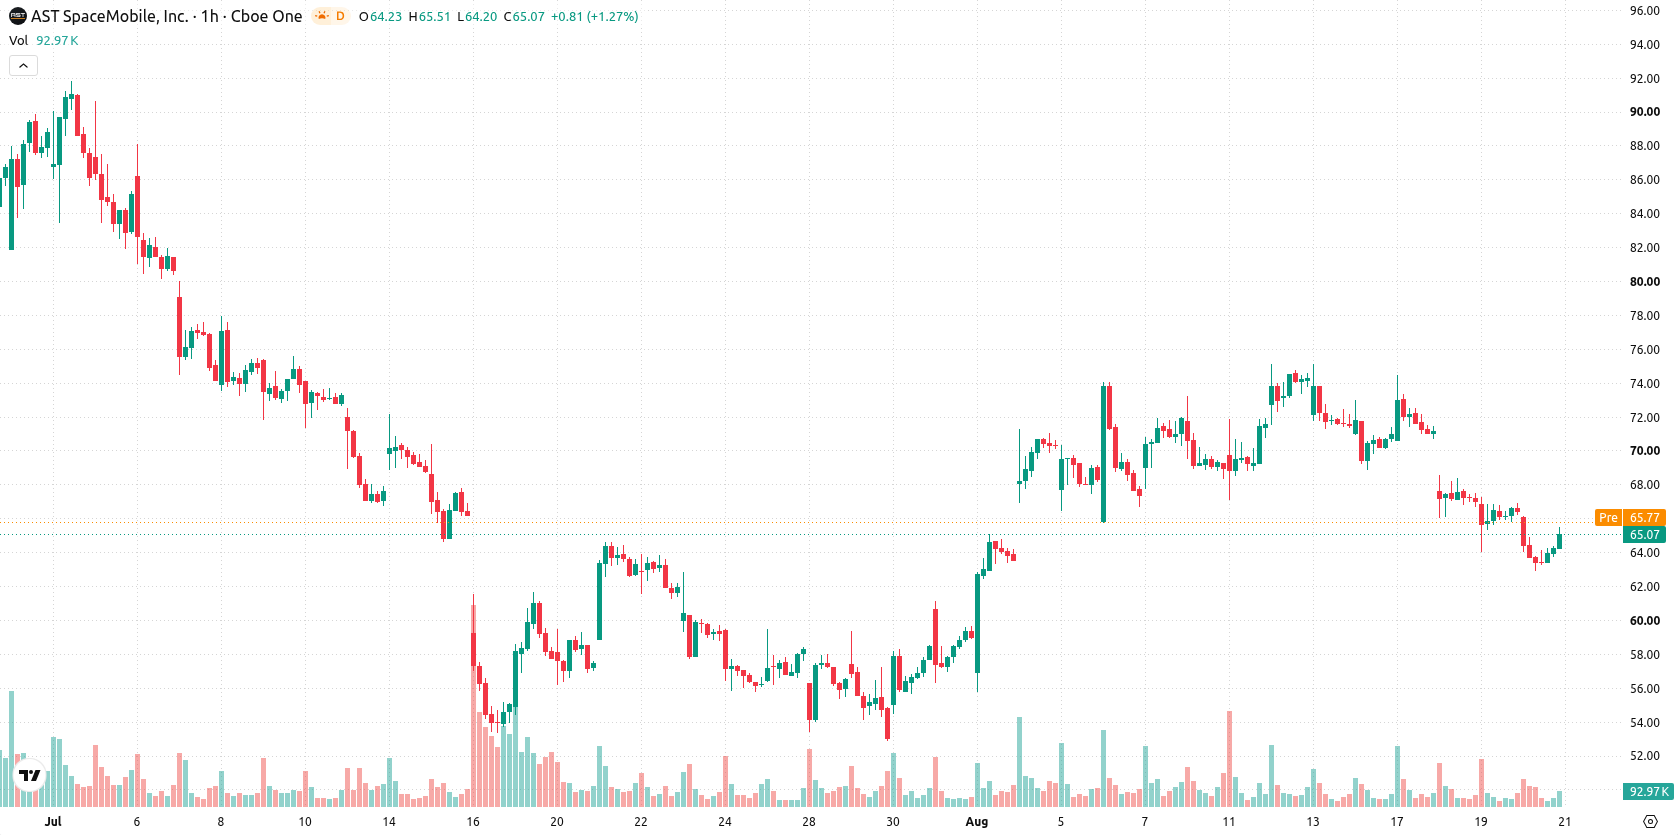
Downtrend momentum holds amid technical divergence and key resistance
Technically, ASTS remains under pressure, trading below the MA-20, MA-50, and notably the MA-200, with the Ichimoku Kijun resistance observed at $67.72. Momentum indicators show MACD and ADX firmly negative, while the RSI stands at 40.34, pointing to continued selling. Stoch RSI is in the overbought zone even as Bull/Bear Power flags the market as oversold intraday, and CCI reads neutral—forming a notable divergence that may signal instability at current levels.
Sideways channel expected as downside risk outweighs rebound odds
Looking ahead, ASTS is forecast to trade within a volatility band between $59.89 and $70.23 over the coming sessions. The probability of further downside is estimated at 60%, with only a 40% chance of a meaningful rebound. Price is likely to hold within a broad sideways channel short term; a break above $67.72 would be needed to trigger a bullish swing, while a decisive fall below $59.89 could open the way for deeper declines.
Earlier, analysts noted that persistent technical and liquidity pressures continued to weigh on AST SpaceMobile and supported a cautious outlook for the stock. The current analysis reinforces that bearish stance, with short-term direction hinging on whether price can stay above the $59.89 support or risks a deeper decline if this level is breached.









-
 Afghanistan
-
 Albania
-
 Algeria
-
 Angola
-
 Argentina
-
 Armenia
-
 Australia
-
 Austria
-
 Azerbaijan
-
 Bahamas
-
 Bahrain
-
 Bangladesh
-
 Belarus
-
 Belgium
-
 Bolivia
-
 Botswana
-
 Brazil
-
 Brunei
-
 Bulgaria
-
 Cambodia
-
 Cameroon
-
 Canada
-
 Chile
-
 China
-
 Colombia
-
 Congo
-
 Costa Rica
-
 Cote d'Ivoire
-
 Croatia
-
 Cuba
-
 Cyprus
-
 Czechia
-
 DR Congo
-
 Denmark
-
 Dominican Republic
-
 Ecuador
-
 Egypt
-
 El Salvador
-
 Estonia
-
 Eswatini
-
 Ethiopia
-
 Finland
-
 France
-
 Georgia
-
 Germany
-
 Ghana
-
 Greece
-
 Haiti
-
 Hong Kong
-
 Hungary
-
 India
-
 Indonesia
-
 Iran, Islamic republic
-
 Iraq
-
 Ireland
-
 Israel
-
 Italy
-
 Jamaica
-
 Japan
-
 Jordan
-
 Kazakhstan
-
 Kenya
-
 Korea
-
 Kuwait
-
 Kyrgyzstan
-
 Laos
-
 Latvia
-
 Lebanon
-
 Lesotho
-
 Libya
-
 Lithuania
-
 Luxembourg
-
 Madagascar
-
 Malaysia
-
 Malta
-
 Mauritius
-
 Mexico
-
 Moldova
-
 Mongolia
-
 Montenegro
-
 Morocco
-
 Mozambique
-
 Myanmar
-
 Namibia
-
 Nepal
-
 Netherlands
-
 New Zealand
-
 Nigeria
-
 North Macedonia
-
 Norway
-
 Oman
-
 Pakistan
-
 Palestine
-
 Panama
-
 Papua New Guinea
-
 Paraguay
-
 Peru
-
 Philippines
-
 Poland
-
 Portugal
-
 Puerto Rico
-
 Qatar
-
 Reunion
-
 Romania
-
 Rwanda
-
 Saudi Arabia
-
 Serbia
-
 Singapore
-
 Slovakia
-
 Slovenia
-
 Somalia
-
 South Africa
-
 Spain
-
 Sri Lanka
-
 Sweden
-
 Switzerland
-
 Syria
-
 Taiwan
-
 Tajikistan
-
 Tanzania
-
 Thailand
-
 Trinidad and Tobago
-
 Tunisia
-
 Turkey
-
 UAE
-
 Uganda
-
 Ukraine
-
 United Kingdom
-
United States
-
 Uruguay
-
 Uzbekistan
-
 Venezuela
-
 Vietnam
-
 Yemen
-
 Zambia
-
 Zimbabwe
- Forex
- Crypto












