


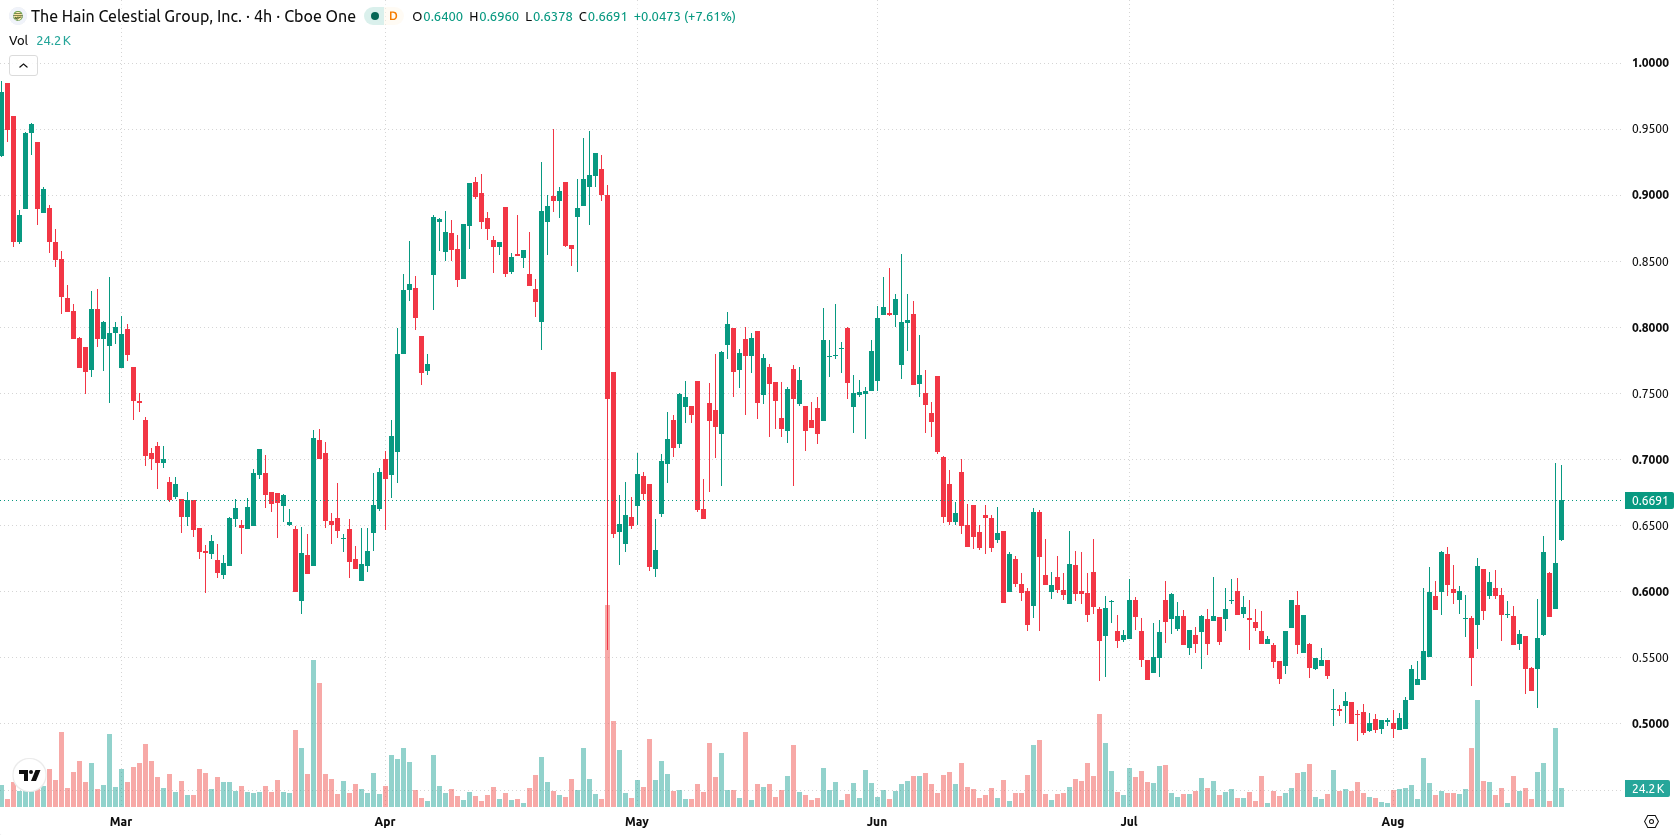
The Hain Celestial Group (HAIN) jumped 7.38% as short- and medium-term technical momentum powered buying interest in the absence of a fresh news catalyst. The move is supported by the stock trading above its 20-day and 50-day moving averages, though long-term structure is still bearish with HAIN below its 200-day average.
 0.1494
0.1521
Highlights
- Shares of Hain Celestial trade with short- and medium-term bullish momentum but remain below long-term technical resistance.
- Overbought signals from oscillators suggest recent 7.38% price advance may face near-term consolidation.
- Expected five-session trading range is $0.58 to $0.79, with immediate support at $0.59 and resistance at $0.68.
Short-term bullish bias holds as overbought signals emerge
HAIN is trading above the 20-day and 50-day moving averages at $0.55 and $0.57, which signals short- and medium-term bullish momentum, while remaining below the longer-term 200-day moving average at $0.85, confirming a bearish long-term setup. The closest support is at $0.59 (Ichimoku Kijun), with resistance at the recent session high of $0.68. Momentum indicators such as MACD and RSI display buying signals, and Bull/Bear Power (BBP) is positive at 0.11, indicating intraday buyer dominance. However, Stochastic RSI and Commodity Channel Index (CCI) reveal strong overbought conditions, and the Average Directional Index (ADX) points to a neutral trend. Intraday volatility reached 18.62%, with price action sustained near intraday highs. This shows firm momentum but several oscillators caution that the stock is overbought.
Earlier, analysts noted that Hain Celestial was entrenched in a sustained bearish technical trend with downside risks prevailing. The recent technical breakout above short- and medium-term moving averages marks a potential shift in short-term momentum, but traders should monitor the $0.59 support and $0.68 resistance as key levels that may define the immediate trading range.






Latest The Hain Celestial Group News




-
 Afghanistan
-
 Albania
-
 Algeria
-
 Angola
-
 Argentina
-
 Armenia
-
 Australia
-
 Austria
-
 Azerbaijan
-
 Bahamas
-
 Bahrain
-
 Bangladesh
-
 Belarus
-
 Belgium
-
 Bolivia
-
 Botswana
-
 Brazil
-
 Brunei
-
 Bulgaria
-
 Cambodia
-
 Cameroon
-
 Canada
-
 Chile
-
 China
-
 Colombia
-
 Congo
-
 Costa Rica
-
 Cote d'Ivoire
-
 Croatia
-
 Cuba
-
 Cyprus
-
 Czechia
-
 DR Congo
-
 Denmark
-
 Dominican Republic
-
 Ecuador
-
 Egypt
-
 El Salvador
-
 Estonia
-
 Eswatini
-
 Ethiopia
-
 Finland
-
 France
-
 Georgia
-
 Germany
-
 Ghana
-
 Greece
-
 Haiti
-
 Hong Kong
-
 Hungary
-
 India
-
 Indonesia
-
 Iran, Islamic republic
-
 Iraq
-
 Ireland
-
 Israel
-
 Italy
-
 Jamaica
-
 Japan
-
 Jordan
-
 Kazakhstan
-
 Kenya
-
 Korea
-
 Kuwait
-
 Kyrgyzstan
-
 Laos
-
 Latvia
-
 Lebanon
-
 Lesotho
-
 Libya
-
 Lithuania
-
 Luxembourg
-
 Madagascar
-
 Malaysia
-
 Malta
-
 Mauritius
-
 Mexico
-
 Moldova
-
 Mongolia
-
 Montenegro
-
 Morocco
-
 Mozambique
-
 Myanmar
-
 Namibia
-
 Nepal
-
 Netherlands
-
 New Zealand
-
 Nigeria
-
 North Macedonia
-
 Norway
-
 Oman
-
 Pakistan
-
 Palestine
-
 Panama
-
 Papua New Guinea
-
 Paraguay
-
 Peru
-
 Philippines
-
 Poland
-
 Portugal
-
 Puerto Rico
-
 Qatar
-
 Reunion
-
 Romania
-
 Rwanda
-
 Saudi Arabia
-
 Serbia
-
 Singapore
-
 Slovakia
-
 Slovenia
-
 Somalia
-
 South Africa
-
 Spain
-
 Sri Lanka
-
 Sweden
-
 Switzerland
-
 Syria
-
 Taiwan
-
 Tajikistan
-
 Tanzania
-
 Thailand
-
 Trinidad and Tobago
-
 Tunisia
-
 Turkey
-
 UAE
-
 Uganda
-
 Ukraine
-
 United Kingdom
-
United States
-
 Uruguay
-
 Uzbekistan
-
 Venezuela
-
 Vietnam
-
 Yemen
-
 Zambia
-
 Zimbabwe
- Forex
- Crypto












