

What's behind Hain Celestial's latest 6.0% share pullback?

Technical selling pressure drove The Hain Celestial Group (HAIN) down 5.99% today, as short-, medium-, and long-term trends all remain negative. The drop is supported by the stock’s failure to reclaim key moving averages and intraday momentum signals that reflect weak conviction among both buyers and sellers.
 0.1341
0.1715
Highlights
- Shares of Hain Celestial trade below key moving averages, indicating sustained downward momentum across all timeframes.
- The immediate range is defined by support at $0.48 and resistance at $0.57, with resistance also aligning near the Ichimoku Kijun.
- Technical indicators present a neutral to bearish outlook, with a high probability of a downward move and the stock recently dropping 5.99% to $0.52.
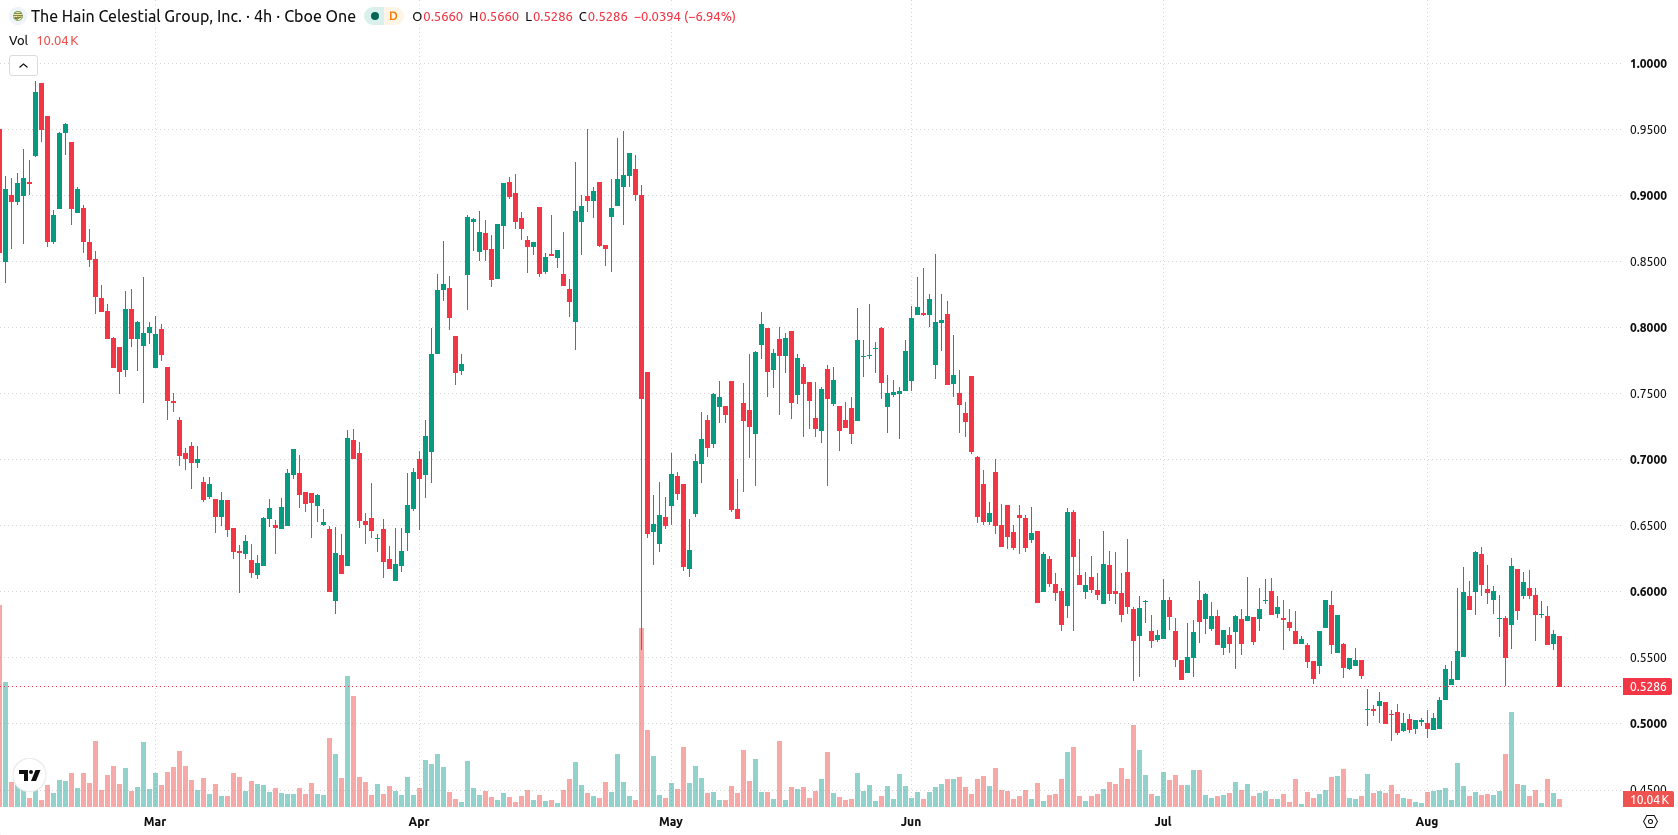
Sustained downtrend affirmed by resistance hold and mixed momentum signals
HAIN is now trading below its 20-day ($0.55), 50-day ($0.57), and 200-day ($0.86) moving averages, confirming persistent downward pressure across all timeframes. The closest resistance is at $0.53, with support at $0.48, while the Ichimoku Kijun line at $0.56 continues to block any reversal attempts. The bearish 50-day versus 200-day alignment marks ongoing negative trend control. Momentum indicators remain mixed: the MACD and ADX both suggest a neutral trend, and the RSI at 48.77 along with the CCI at 47.54 show no overbought or oversold extremes. Stochastic RSI maintains a neutral stance, and Bull/Bear Power (BBP) at 0.05 points to a slight advantage for buyers during the session. After an initial upside gap of 1.79%, HAIN reversed sharply toward session lows as intraday volatility reached 5.87%.
Earlier, analysts noted that Hain Celestial was entrenched in a persistent bearish technical trend with little sign of a near-term reversal. The current analysis reinforces this view, highlighting that the ongoing inability to reclaim key moving averages keeps downside risks elevated, with potential volatility should the $0.48 support level break.






Latest The Hain Celestial Group News




-
 Afghanistan
-
 Albania
-
 Algeria
-
 Angola
-
 Argentina
-
 Armenia
-
 Australia
-
 Austria
-
 Azerbaijan
-
 Bahamas
-
 Bahrain
-
 Bangladesh
-
 Belarus
-
 Belgium
-
 Bolivia
-
 Botswana
-
 Brazil
-
 Brunei
-
 Bulgaria
-
 Cambodia
-
 Cameroon
-
 Canada
-
 Chile
-
 China
-
 Colombia
-
 Congo
-
 Costa Rica
-
 Cote d'Ivoire
-
 Croatia
-
 Cuba
-
 Cyprus
-
 Czechia
-
 DR Congo
-
 Denmark
-
 Dominican Republic
-
 Ecuador
-
 Egypt
-
 El Salvador
-
 Estonia
-
 Eswatini
-
 Ethiopia
-
 Finland
-
 France
-
 Georgia
-
 Germany
-
 Ghana
-
 Greece
-
 Haiti
-
 Hong Kong
-
 Hungary
-
 India
-
 Indonesia
-
 Iran, Islamic republic
-
 Iraq
-
 Ireland
-
 Israel
-
 Italy
-
 Jamaica
-
 Japan
-
 Jordan
-
 Kazakhstan
-
 Kenya
-
 Korea
-
 Kuwait
-
 Kyrgyzstan
-
 Laos
-
 Latvia
-
 Lebanon
-
 Lesotho
-
 Libya
-
 Lithuania
-
 Luxembourg
-
 Madagascar
-
 Malaysia
-
 Malta
-
 Mauritius
-
 Mexico
-
 Moldova
-
 Mongolia
-
 Montenegro
-
 Morocco
-
 Mozambique
-
 Myanmar
-
 Namibia
-
 Nepal
-
 Netherlands
-
 New Zealand
-
 Nigeria
-
 North Macedonia
-
 Norway
-
 Oman
-
 Pakistan
-
 Palestine
-
 Panama
-
 Papua New Guinea
-
 Paraguay
-
 Peru
-
 Philippines
-
 Poland
-
 Portugal
-
 Puerto Rico
-
 Qatar
-
 Reunion
-
 Romania
-
 Rwanda
-
 Saudi Arabia
-
 Serbia
-
 Singapore
-
 Slovakia
-
 Slovenia
-
 Somalia
-
 South Africa
-
 Spain
-
 Sri Lanka
-
 Sweden
-
 Switzerland
-
 Syria
-
 Taiwan
-
 Tajikistan
-
 Tanzania
-
 Thailand
-
 Trinidad and Tobago
-
 Tunisia
-
 Turkey
-
 UAE
-
 Uganda
-
 Ukraine
-
 United Kingdom
-
United States
-
 Uruguay
-
 Uzbekistan
-
 Venezuela
-
 Vietnam
-
 Yemen
-
 Zambia
-
 Zimbabwe
- Forex
- Crypto












