

Futu Holdings shares gain almost 9% after robust revenue surge and record trading volumes

Futu Holdings Ltd. Sponsored ADR (FUTU) surged 8.65% as investors responded to the company’s robust second-quarter earnings report, which featured strong revenue and net income growth. The upward momentum is supported in the short and medium term by price strength above both the 20-day and 50-day moving averages, though the longer-term trend remains cautious with the stock still below its 200-day average.
 96.00
101.63
Highlights
- Futu Holdings reported a 36% revenue increase to HK$7.2 billion and a 41.6% rise in net income to HK$3.6 billion for the second quarter of 2026.
- Record trading volumes of HK$6.42 trillion and new securities-backed margin products for virtual assets followed regulatory approval in Hong Kong.
- Shares of Futu Holdings trade with strong short- and medium-term upward momentum near $122.48, with a projected five-session range of $116.73 to $132.92 and a 67% probability of further upward moves amid overbought technical signals.
Revenue and net income growth offset regulatory risks and legal concerns
Futu Holdings released its unaudited second-quarter 2026 financial results, reporting a 36% year-over-year revenue increase to HK$7.2 billion and a 41.6% rise in net income to HK$3.6 billion. Trading volumes reached a record HK$6.42 trillion, driven by increased activity in U.S. stocks and a rebound in Hong Kong IPOs. The company expanded new products, including securities-backed margin financing for virtual assets in Hong Kong after receiving regulatory approval, and repurchased approximately 3.8 million ADSs valued at $418 million. Operational growth was accompanied by an ongoing class action lawsuit regarding prior regulatory penalties and share price volatility.
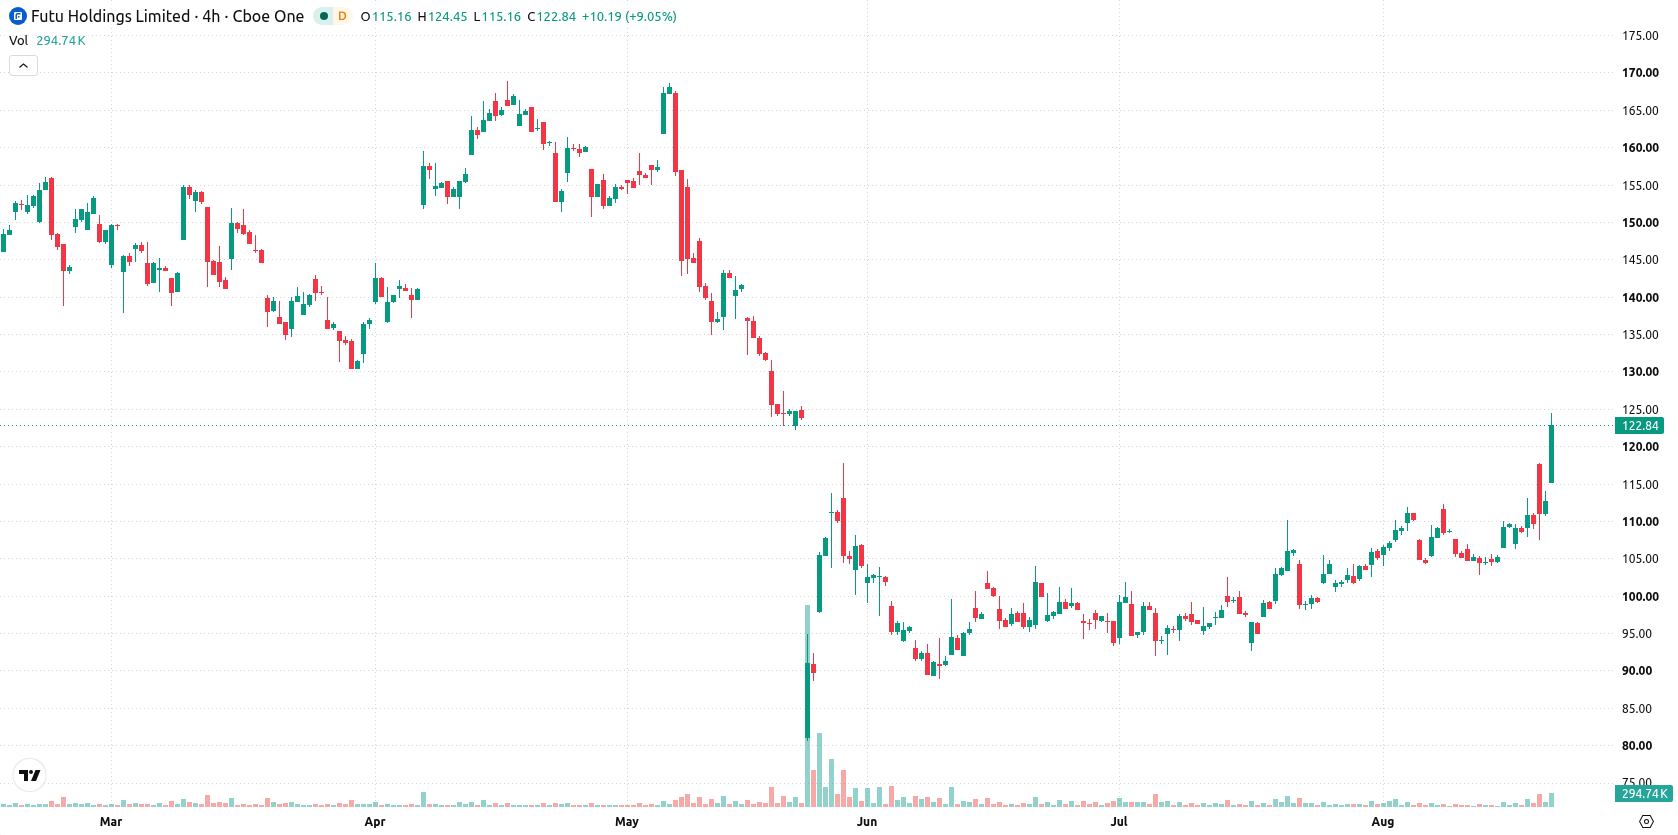
Momentum signals strengthen as long-term resistance tempers bullish case
FUTU is trading above its 20-day and 50-day moving averages at $106.24 and $101.03, highlighting strong upward momentum in the short and medium term. However, the price remains below the 200-day moving average at $140.68, which aligns with a bearish long-term technical structure. The Ichimoku Kijun offers support at $105.19, with near-term resistance seen at $124.36 and support at $117.66. Technical indicators are mixed: the MACD and RSI (62.33) are both in bullish territory, while the Stochastic RSI, CCI, and Bull/Bear Power signal overbought conditions. The Awesome Oscillator supports further gains, while the ADX remains neutral. Intraday volatility stands at 7.11%.
Earlier, analysts noted that Futu Holdings faced persistent regulatory and legal challenges, fostering a cautious long-term outlook despite episodes of short-term upside. The latest quarterly results and technical signals now add a new dimension, suggesting the next decisive move will hinge on whether the stock can breakout above $124.36 or face downside risk below $117.66.










-
 Afghanistan
-
 Albania
-
 Algeria
-
 Angola
-
 Argentina
-
 Armenia
-
 Australia
-
 Austria
-
 Azerbaijan
-
 Bahamas
-
 Bahrain
-
 Bangladesh
-
 Belarus
-
 Belgium
-
 Bolivia
-
 Botswana
-
 Brazil
-
 Brunei
-
 Bulgaria
-
 Cambodia
-
 Cameroon
-
 Canada
-
 Chile
-
 China
-
 Colombia
-
 Congo
-
 Costa Rica
-
 Cote d'Ivoire
-
 Croatia
-
 Cuba
-
 Cyprus
-
 Czechia
-
 DR Congo
-
 Denmark
-
 Dominican Republic
-
 Ecuador
-
 Egypt
-
 El Salvador
-
 Estonia
-
 Eswatini
-
 Ethiopia
-
 Finland
-
 France
-
 Georgia
-
 Germany
-
 Ghana
-
 Greece
-
 Haiti
-
 Hong Kong
-
 Hungary
-
 India
-
 Indonesia
-
 Iran, Islamic republic
-
 Iraq
-
 Ireland
-
 Israel
-
 Italy
-
 Jamaica
-
 Japan
-
 Jordan
-
 Kazakhstan
-
 Kenya
-
 Korea
-
 Kuwait
-
 Kyrgyzstan
-
 Laos
-
 Latvia
-
 Lebanon
-
 Lesotho
-
 Libya
-
 Lithuania
-
 Luxembourg
-
 Madagascar
-
 Malaysia
-
 Malta
-
 Mauritius
-
 Mexico
-
 Moldova
-
 Mongolia
-
 Montenegro
-
 Morocco
-
 Mozambique
-
 Myanmar
-
 Namibia
-
 Nepal
-
 Netherlands
-
 New Zealand
-
 Nigeria
-
 North Macedonia
-
 Norway
-
 Oman
-
 Pakistan
-
 Palestine
-
 Panama
-
 Papua New Guinea
-
 Paraguay
-
 Peru
-
 Philippines
-
 Poland
-
 Portugal
-
 Puerto Rico
-
 Qatar
-
 Reunion
-
 Romania
-
 Rwanda
-
 Saudi Arabia
-
 Serbia
-
 Singapore
-
 Slovakia
-
 Slovenia
-
 Somalia
-
 South Africa
-
 Spain
-
 Sri Lanka
-
 Sweden
-
 Switzerland
-
 Syria
-
 Taiwan
-
 Tajikistan
-
 Tanzania
-
 Thailand
-
 Trinidad and Tobago
-
 Tunisia
-
 Turkey
-
 UAE
-
 Uganda
-
 Ukraine
-
 United Kingdom
-
United States
-
 Uruguay
-
 Uzbekistan
-
 Venezuela
-
 Vietnam
-
 Yemen
-
 Zambia
-
 Zimbabwe
- Forex
- Crypto












