

Futu shares drop more than 5% after breaching key moving averages and strong intraday selling

Futu Holdings Ltd. Sponsored ADR (FUTU) slumped 5.1% today as persistent technical weakness and strong selling pressure drove price action lower. The move is supported by the stock trading below all key moving averages and clear dominance by sellers intraday.
 99.77
106.98
Highlights
- Futu stock is trading below its key 20-day, 50-day, and 200-day moving averages, confirming persistent downside momentum.
- Momentum and trend indicators including MACD, ADX, CCI, and Bull/Bear Power indicate continued seller dominance and oversold conditions.
- Futu stock is projected to remain in a $93.62 to $102.31 range, with over 80% probability of further declines unless $101.68 is breached.
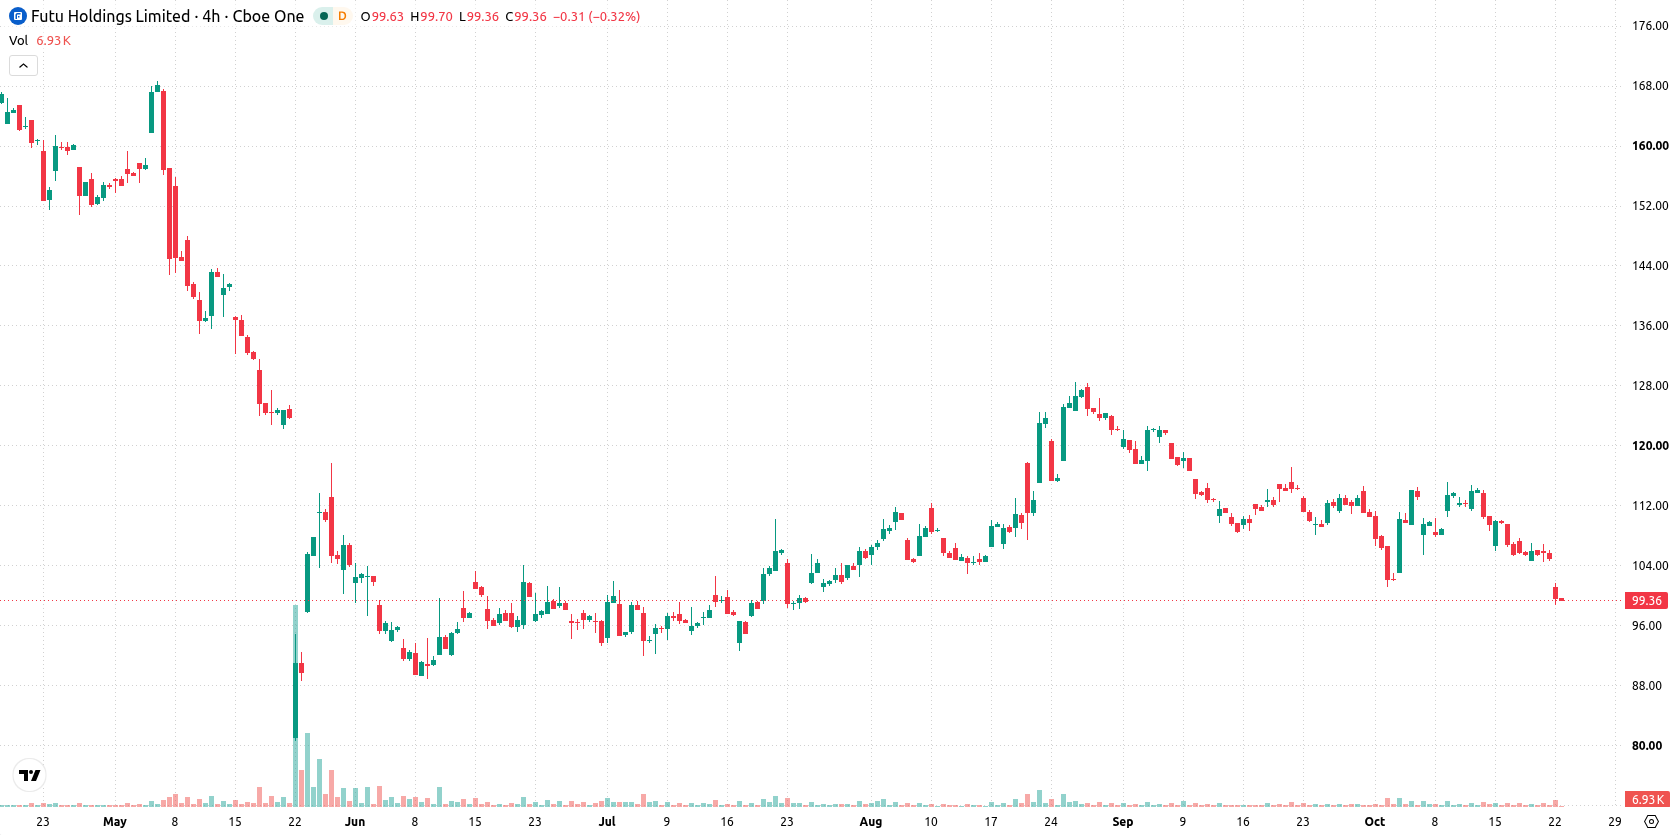
Persistent bearish momentum as downside barriers remain intact
Futu is trading below its 20-day, 50-day, and 200-day moving averages ($109.41, $112.81, and $128.22), signaling sustained downside pressure across all trend timeframes. The near-term ceiling is at $101.68 with the nearest floor at $98.76, and the moving average alignment points to a bearish long-term setup. Momentum indicators remain negative, with the MACD in sell territory and the ADX reflecting a weak trend. The RSI is at 41.68 and trending toward oversold. The CCI at -107.65 and BBP at -1.46 both confirm oversold conditions and dominance by sellers intraday. The Stochastic RSI reads neutral, diverging from the firm sell signals on the other oscillators. The Awesome Oscillator (AO) is negative, supporting ongoing weakness. Futu is down $5.36 or 5.1% on the day after a downside gap of about $4.02 (3.83%) and is trading near the session low. Intraday volatility stands at 2.96%. The tone is negative with selling pressure dominating after the open.
Earlier, analysts cautioned that Futu faced persistent regulatory headwinds and a generally bearish technical outlook. The current breakdown below all major moving averages further strengthens the bearish scenario, with traders advised to closely monitor the $98.76 support as a decisive inflection point for near-term downside risk.






Latest Futu Holdings Ltd. Sponsored ADR News




-
 Afghanistan
-
 Albania
-
 Algeria
-
 Angola
-
 Argentina
-
 Armenia
-
 Australia
-
 Austria
-
 Azerbaijan
-
 Bahamas
-
 Bahrain
-
 Bangladesh
-
 Belarus
-
 Belgium
-
 Bolivia
-
 Botswana
-
 Brazil
-
 Brunei
-
 Bulgaria
-
 Cambodia
-
 Cameroon
-
 Canada
-
 Chile
-
 China
-
 Colombia
-
 Congo
-
 Costa Rica
-
 Cote d'Ivoire
-
 Croatia
-
 Cuba
-
 Cyprus
-
 Czechia
-
 DR Congo
-
 Denmark
-
 Dominican Republic
-
 Ecuador
-
 Egypt
-
 El Salvador
-
 Estonia
-
 Eswatini
-
 Ethiopia
-
 Finland
-
 France
-
 Georgia
-
 Germany
-
 Ghana
-
 Greece
-
 Haiti
-
 Hong Kong
-
 Hungary
-
 India
-
 Indonesia
-
 Iran, Islamic republic
-
 Iraq
-
 Ireland
-
 Israel
-
 Italy
-
 Jamaica
-
 Japan
-
 Jordan
-
 Kazakhstan
-
 Kenya
-
 Korea
-
 Kuwait
-
 Kyrgyzstan
-
 Laos
-
 Latvia
-
 Lebanon
-
 Lesotho
-
 Libya
-
 Lithuania
-
 Luxembourg
-
 Madagascar
-
 Malaysia
-
 Malta
-
 Mauritius
-
 Mexico
-
 Moldova
-
 Mongolia
-
 Montenegro
-
 Morocco
-
 Mozambique
-
 Myanmar
-
 Namibia
-
 Nepal
-
 Netherlands
-
 New Zealand
-
 Nigeria
-
 North Macedonia
-
 Norway
-
 Oman
-
 Pakistan
-
 Palestine
-
 Panama
-
 Papua New Guinea
-
 Paraguay
-
 Peru
-
 Philippines
-
 Poland
-
 Portugal
-
 Puerto Rico
-
 Qatar
-
 Reunion
-
 Romania
-
 Rwanda
-
 Saudi Arabia
-
 Serbia
-
 Singapore
-
 Slovakia
-
 Slovenia
-
 Somalia
-
 South Africa
-
 Spain
-
 Sri Lanka
-
 Sweden
-
 Switzerland
-
 Syria
-
 Taiwan
-
 Tajikistan
-
 Tanzania
-
 Thailand
-
 Trinidad and Tobago
-
 Tunisia
-
 Turkey
-
 UAE
-
 Uganda
-
 Ukraine
-
 United Kingdom
-
United States
-
 Uruguay
-
 Uzbekistan
-
 Venezuela
-
 Vietnam
-
 Yemen
-
 Zambia
-
 Zimbabwe
- Forex
- Crypto












