


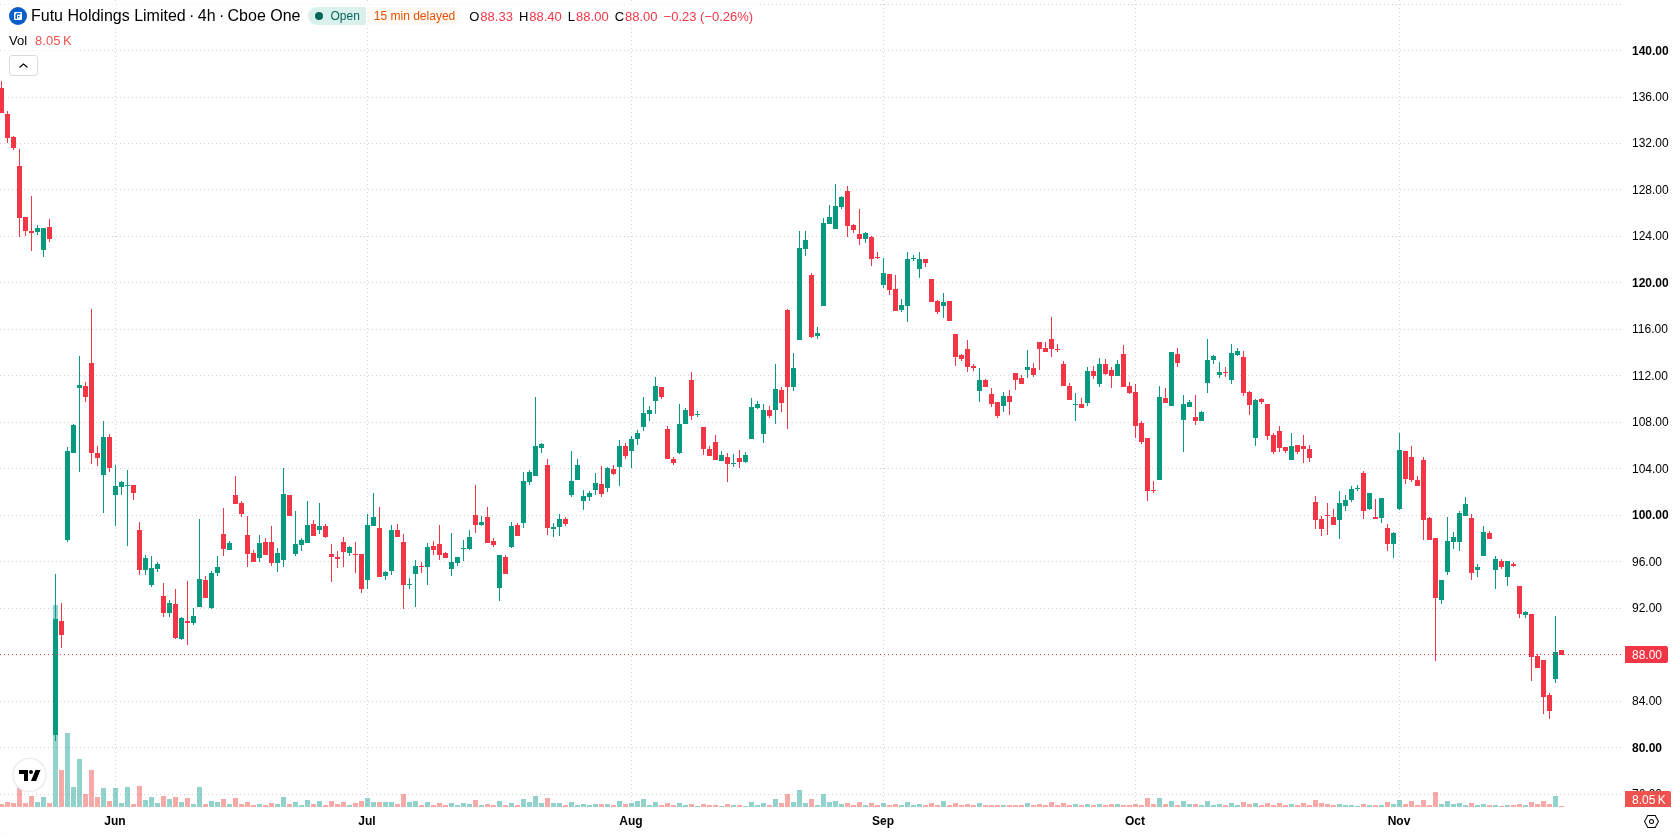
Futu Holdings Ltd. Sponsored ADR (FUTU) surged 5.96% after its latest quarterly results highlighted revenue growth, a rise in funded accounts, and new product launches, attracting renewed buying interest. The move looks limited, with the stock still trading below its 20-day, 50-day, and 200-day moving averages, reinforcing a broader bearish bias.
 91.29
96.00
Highlights
- Futu reported third-quarter revenue growth of 4.5% year-over-year to HK$6.69 billion with funded accounts up 27.9% to 4.01 million.
- Wealth management client assets rose 11.8% to HK$196.4 billion as Futu made new mutual fund and tokenized gold ETF offerings available in Hong Kong.
- Futu stock trades below key moving averages with technical indicators showing strong selling pressure and a forecast range of $81.22 to $95.88.
Revenue gains and product launches drive client asset growth
Futu reported unaudited third-quarter 2026 financial results on November 19. Total revenues increased by 4.5% year-over-year to HK$6.69 billion, with funded accounts rising 27.9% to approximately 4.01 million. Wealth management client assets grew 11.8% to HK$196.4 billion as the company launched a weekly-dealing public mutual fund and a fully tokenized gold ETF in Hong Kong. The dividend yield for the period was 3.47% with a low payout ratio, and client retention remained above 98%.
Technical weakness persists as momentum signals amplify bearish trend
FUTU is trading below its 20-day, 50-day, and 200-day moving averages ($97.34, $105.06, and $120.89 respectively), indicating persistent bearish pressure across all timeframes. The near-term resistance is at $91.27 and support is at $85.52, with more distant resistance levels above the current price further highlighting the prevailing downward trend. Momentum indicators reinforce this negative outlook, as both MACD and ADX signal selling pressure. The RSI, Stochastic RSI, and CCI are all in oversold zones, suggesting potential for a technical rebound but no confirmation of a trend reversal. Bull/Bear Power remains negative, and the Awesome Oscillator is aligned with current selling pressure. Intraday volatility is high at 6.72%, and intraday gains occur amid ongoing bearish momentum, creating a divergence between price action and underlying signals.
Earlier, analysts noted that Futu Holdings was under persistent technical pressure with a broadly bearish outlook. The latest results add a positive operational dimension but do not alter the prevailing bearish technical trend, so traders should closely monitor the $85.52 support level as a potential inflection point in the coming sessions.






Latest Futu Holdings Ltd. Sponsored ADR News




-
 Afghanistan
-
 Albania
-
 Algeria
-
 Angola
-
 Argentina
-
 Armenia
-
 Australia
-
 Austria
-
 Azerbaijan
-
 Bahamas
-
 Bahrain
-
 Bangladesh
-
 Belarus
-
 Belgium
-
 Bolivia
-
 Botswana
-
 Brazil
-
 Brunei
-
 Bulgaria
-
 Cambodia
-
 Cameroon
-
 Canada
-
 Chile
-
 China
-
 Colombia
-
 Congo
-
 Costa Rica
-
 Cote d'Ivoire
-
 Croatia
-
 Cuba
-
 Cyprus
-
 Czechia
-
 DR Congo
-
 Denmark
-
 Dominican Republic
-
 Ecuador
-
 Egypt
-
 El Salvador
-
 Estonia
-
 Eswatini
-
 Ethiopia
-
 Finland
-
 France
-
 Georgia
-
 Germany
-
 Ghana
-
 Greece
-
 Haiti
-
 Hong Kong
-
 Hungary
-
 India
-
 Indonesia
-
 Iran, Islamic republic
-
 Iraq
-
 Ireland
-
 Israel
-
 Italy
-
 Jamaica
-
 Japan
-
 Jordan
-
 Kazakhstan
-
 Kenya
-
 Korea
-
 Kuwait
-
 Kyrgyzstan
-
 Laos
-
 Latvia
-
 Lebanon
-
 Lesotho
-
 Libya
-
 Lithuania
-
 Luxembourg
-
 Madagascar
-
 Malaysia
-
 Malta
-
 Mauritius
-
 Mexico
-
 Moldova
-
 Mongolia
-
 Montenegro
-
 Morocco
-
 Mozambique
-
 Myanmar
-
 Namibia
-
 Nepal
-
 Netherlands
-
 New Zealand
-
 Nigeria
-
 North Macedonia
-
 Norway
-
 Oman
-
 Pakistan
-
 Palestine
-
 Panama
-
 Papua New Guinea
-
 Paraguay
-
 Peru
-
 Philippines
-
 Poland
-
 Portugal
-
 Puerto Rico
-
 Qatar
-
 Reunion
-
 Romania
-
 Rwanda
-
 Saudi Arabia
-
 Serbia
-
 Singapore
-
 Slovakia
-
 Slovenia
-
 Somalia
-
 South Africa
-
 Spain
-
 Sri Lanka
-
 Sweden
-
 Switzerland
-
 Syria
-
 Taiwan
-
 Tajikistan
-
 Tanzania
-
 Thailand
-
 Trinidad and Tobago
-
 Tunisia
-
 Turkey
-
 UAE
-
 Uganda
-
 Ukraine
-
 United Kingdom
-
United States
-
 Uruguay
-
 Uzbekistan
-
 Venezuela
-
 Vietnam
-
 Yemen
-
 Zambia
-
 Zimbabwe
- Forex
- Crypto












