


Futu Holdings Ltd. Sponsored ADR (FUTU) fell 3.84% following the release of its Q3 2026 financial results, which showed revenue growth but were released into a session defined by persistent selling pressure. The scale and persistence of the decline are supported by ongoing bearish signals as the stock trades below all major moving averages.
 88.98
93.75
Highlights
- Futu posted a 4.5% year-over-year increase in Q3 2026 revenue to HK$6.69 billion and exceeded 4 million funded accounts.
- New offerings included a weekly-dealing public mutual fund and a fully tokenized gold ETF in Hong Kong, with international account growth and strong client retention.
- Shares of Futu are trading below key moving averages with prevailing selling pressure and are expected to trade between $78.2 and $89.55 over the next 5 days.
Revenue growth and product launches countered by persistent price pressure
Futu reported unaudited Q3 2026 financial results with total revenue of HK$6.69 billion, marking a 4.5% increase year-over-year. The company recorded growth in funded accounts to over 4 million and higher client assets in wealth management. New product launches included a weekly-dealing public mutual fund and a fully tokenized gold ETF in Hong Kong, alongside notable international account growth and high client retention. Platform expansion and product diversification continued, though price action has remained under broader selling pressure.
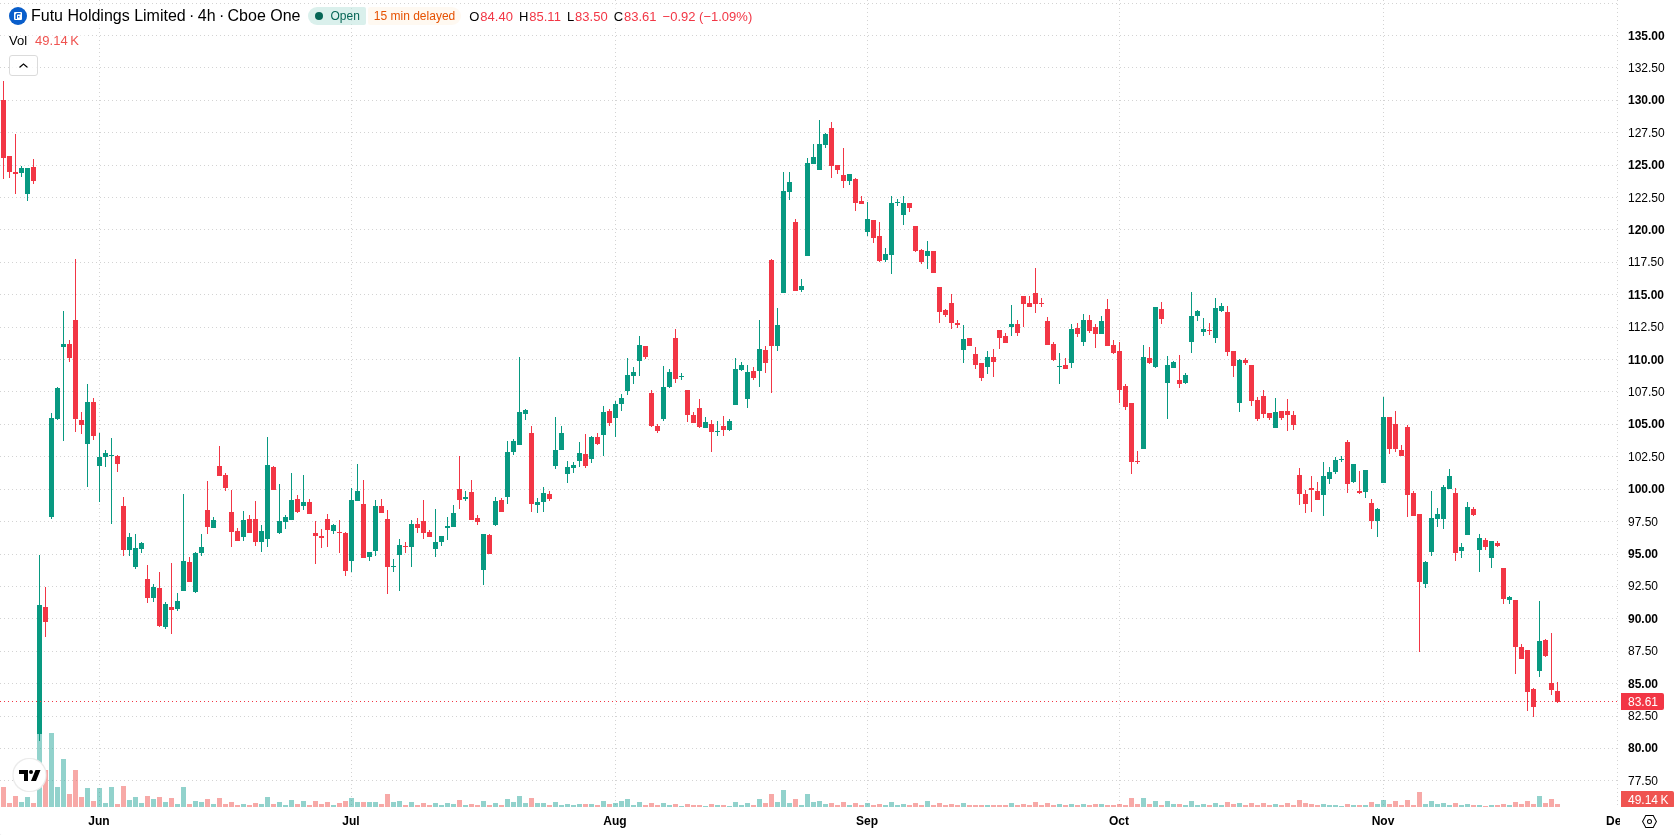
Bearish trends reinforced as key averages break, oscillators diverge
Futu is trading below its 20-day, 50-day, and 200-day moving averages ($96.76, $104.53, and $120.56), indicating sustained bearish pressure across short, medium, and long-term trends. The nearest resistance is at $84.83, with support at $82.4. The prevailing downtrend is reinforced by the bearish alignment of the 50-day and 200-day moving averages. Momentum indicators, including MACD and ADX, point to ongoing selling activity. The RSI and Stochastic RSI are neutral, while the CCI is in the oversold zone, highlighting the possibility of a rebound though not confirming it. Bull/Bear Power reflects dominant selling in intraday momentum, and the Awesome Oscillator remains negative, which aligns with the current broader downtrend. Oscillator divergence is present, as CCI is oversold but RSI and Stochastic RSI remain neutral.
Earlier, analysts noted that despite positive operational metrics, Futu Holdings continued to face persistent technical weakness and a broadly bearish outlook. The current article strengthens this view with further confirmation of ongoing downside pressure, highlighting $82.4 as a key support level that traders should monitor for potential risk in the days ahead.






Latest Futu Holdings Ltd. Sponsored ADR News




-
 Afghanistan
-
 Albania
-
 Algeria
-
 Angola
-
 Argentina
-
 Armenia
-
 Australia
-
 Austria
-
 Azerbaijan
-
 Bahamas
-
 Bahrain
-
 Bangladesh
-
 Belarus
-
 Belgium
-
 Bolivia
-
 Botswana
-
 Brazil
-
 Brunei
-
 Bulgaria
-
 Cambodia
-
 Cameroon
-
 Canada
-
 Chile
-
 China
-
 Colombia
-
 Congo
-
 Costa Rica
-
 Cote d'Ivoire
-
 Croatia
-
 Cuba
-
 Cyprus
-
 Czechia
-
 DR Congo
-
 Denmark
-
 Dominican Republic
-
 Ecuador
-
 Egypt
-
 El Salvador
-
 Estonia
-
 Eswatini
-
 Ethiopia
-
 Finland
-
 France
-
 Georgia
-
 Germany
-
 Ghana
-
 Greece
-
 Haiti
-
 Hong Kong
-
 Hungary
-
 India
-
 Indonesia
-
 Iran, Islamic republic
-
 Iraq
-
 Ireland
-
 Israel
-
 Italy
-
 Jamaica
-
 Japan
-
 Jordan
-
 Kazakhstan
-
 Kenya
-
 Korea
-
 Kuwait
-
 Kyrgyzstan
-
 Laos
-
 Latvia
-
 Lebanon
-
 Lesotho
-
 Libya
-
 Lithuania
-
 Luxembourg
-
 Madagascar
-
 Malaysia
-
 Malta
-
 Mauritius
-
 Mexico
-
 Moldova
-
 Mongolia
-
 Montenegro
-
 Morocco
-
 Mozambique
-
 Myanmar
-
 Namibia
-
 Nepal
-
 Netherlands
-
 New Zealand
-
 Nigeria
-
 North Macedonia
-
 Norway
-
 Oman
-
 Pakistan
-
 Palestine
-
 Panama
-
 Papua New Guinea
-
 Paraguay
-
 Peru
-
 Philippines
-
 Poland
-
 Portugal
-
 Puerto Rico
-
 Qatar
-
 Reunion
-
 Romania
-
 Rwanda
-
 Saudi Arabia
-
 Serbia
-
 Singapore
-
 Slovakia
-
 Slovenia
-
 Somalia
-
 South Africa
-
 Spain
-
 Sri Lanka
-
 Sweden
-
 Switzerland
-
 Syria
-
 Taiwan
-
 Tajikistan
-
 Tanzania
-
 Thailand
-
 Trinidad and Tobago
-
 Tunisia
-
 Turkey
-
 UAE
-
 Uganda
-
 Ukraine
-
 United Kingdom
-
United States
-
 Uruguay
-
 Uzbekistan
-
 Venezuela
-
 Vietnam
-
 Yemen
-
 Zambia
-
 Zimbabwe
- Forex
- Crypto












