

Nano Dimension stock breakout attempt at $1.55 resistance: Key levels to watch

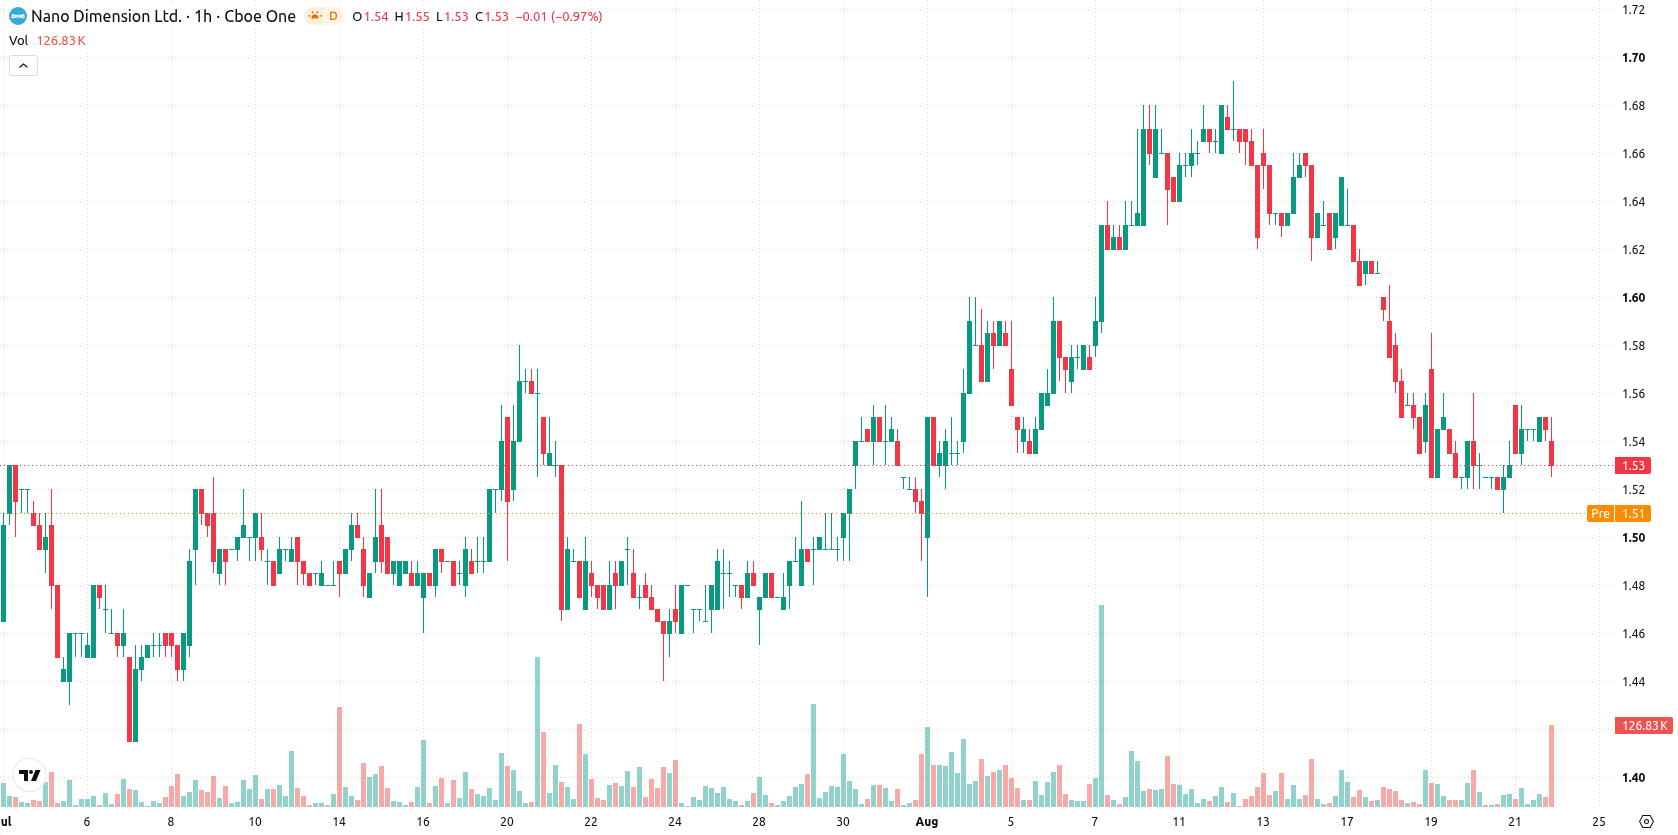
Nano Dimension (NNDM) stock is trading at $1.54 after rising 1.32% on the day. The price currently sits above its key short-term moving average but remains below intermediate- and long-term averages.
 1.34
1.39
Highlights
- NNDM/USD is trading above its short-term average but remains below key medium- and long-term moving averages.
- Momentum indicators such as MACD, RSI and Stoch RSI produce persistent sell signals, with medium-term selling pressure dominating.
- Price is expected to stay between $1.48 and $1.60, with less than a 20% chance of an upward breakout and over 80% probability of renewed selling.
Mixed technical signals as immediate resistance challenges weak momentum
On the technical front, NNDM is trading above its MA-20 at $1.54 while remaining below the MA-50 ($1.58) on the hourly chart and the MA-200 ($1.67) on the daily chart. The Ichimoku Kijun at $1.55 serves as immediate resistance. Momentum indicators are broadly negative: MACD signals a strong sell, ADX is neutral, and RSI is at 44.37 (Sell). Stochastic RSI is at strong sell, CCI is neutral, Bull/Bear Power indicates buyer dominance intraday, but this is contradicted by overall momentum, and AO is neutral.
Downside risk rises as volatility band limits bullish potential
In the short term, NNDM is expected to remain within a volatility band of $1.48 to $1.60. The probability of a sustained upward move is very low (less than 20%), while the likelihood of a decline is significantly higher (over 80%). The baseline scenario favors sideways movement; a breakout above $1.55 would be needed for a bullish reversal, while a drop below $1.48 could trigger renewed selling.
Earlier, analysts noted that Nano Dimension shares were experiencing sustained bearish pressure with technical indicators confirming a negative trend. The current analysis reinforces this outlook, highlighting $1.55 as a key level to watch for any potential bullish reversal in the near term.






Latest Nano Dimension News




-
 Afghanistan
-
 Albania
-
 Algeria
-
 Angola
-
 Argentina
-
 Armenia
-
 Australia
-
 Austria
-
 Azerbaijan
-
 Bahamas
-
 Bahrain
-
 Bangladesh
-
 Belarus
-
 Belgium
-
 Bolivia
-
 Botswana
-
 Brazil
-
 Brunei
-
 Bulgaria
-
 Cambodia
-
 Cameroon
-
 Canada
-
 Chile
-
 China
-
 Colombia
-
 Congo
-
 Costa Rica
-
 Cote d'Ivoire
-
 Croatia
-
 Cuba
-
 Cyprus
-
 Czechia
-
 DR Congo
-
 Denmark
-
 Dominican Republic
-
 Ecuador
-
 Egypt
-
 El Salvador
-
 Estonia
-
 Eswatini
-
 Ethiopia
-
 Finland
-
 France
-
 Georgia
-
 Germany
-
 Ghana
-
 Greece
-
 Haiti
-
 Hong Kong
-
 Hungary
-
 India
-
 Indonesia
-
 Iran, Islamic republic
-
 Iraq
-
 Ireland
-
 Israel
-
 Italy
-
 Jamaica
-
 Japan
-
 Jordan
-
 Kazakhstan
-
 Kenya
-
 Korea
-
 Kuwait
-
 Kyrgyzstan
-
 Laos
-
 Latvia
-
 Lebanon
-
 Lesotho
-
 Libya
-
 Lithuania
-
 Luxembourg
-
 Madagascar
-
 Malaysia
-
 Malta
-
 Mauritius
-
 Mexico
-
 Moldova
-
 Mongolia
-
 Montenegro
-
 Morocco
-
 Mozambique
-
 Myanmar
-
 Namibia
-
 Nepal
-
 Netherlands
-
 New Zealand
-
 Nigeria
-
 North Macedonia
-
 Norway
-
 Oman
-
 Pakistan
-
 Palestine
-
 Panama
-
 Papua New Guinea
-
 Paraguay
-
 Peru
-
 Philippines
-
 Poland
-
 Portugal
-
 Puerto Rico
-
 Qatar
-
 Reunion
-
 Romania
-
 Rwanda
-
 Saudi Arabia
-
 Serbia
-
 Singapore
-
 Slovakia
-
 Slovenia
-
 Somalia
-
 South Africa
-
 Spain
-
 Sri Lanka
-
 Sweden
-
 Switzerland
-
 Syria
-
 Taiwan
-
 Tajikistan
-
 Tanzania
-
 Thailand
-
 Trinidad and Tobago
-
 Tunisia
-
 Turkey
-
 UAE
-
 Uganda
-
 Ukraine
-
 United Kingdom
-
United States
-
 Uruguay
-
 Uzbekistan
-
 Venezuela
-
 Vietnam
-
 Yemen
-
 Zambia
-
 Zimbabwe
- Forex
- Crypto












