

RGTI slides nearly 6% as price remains below key moving averages and sellers take control

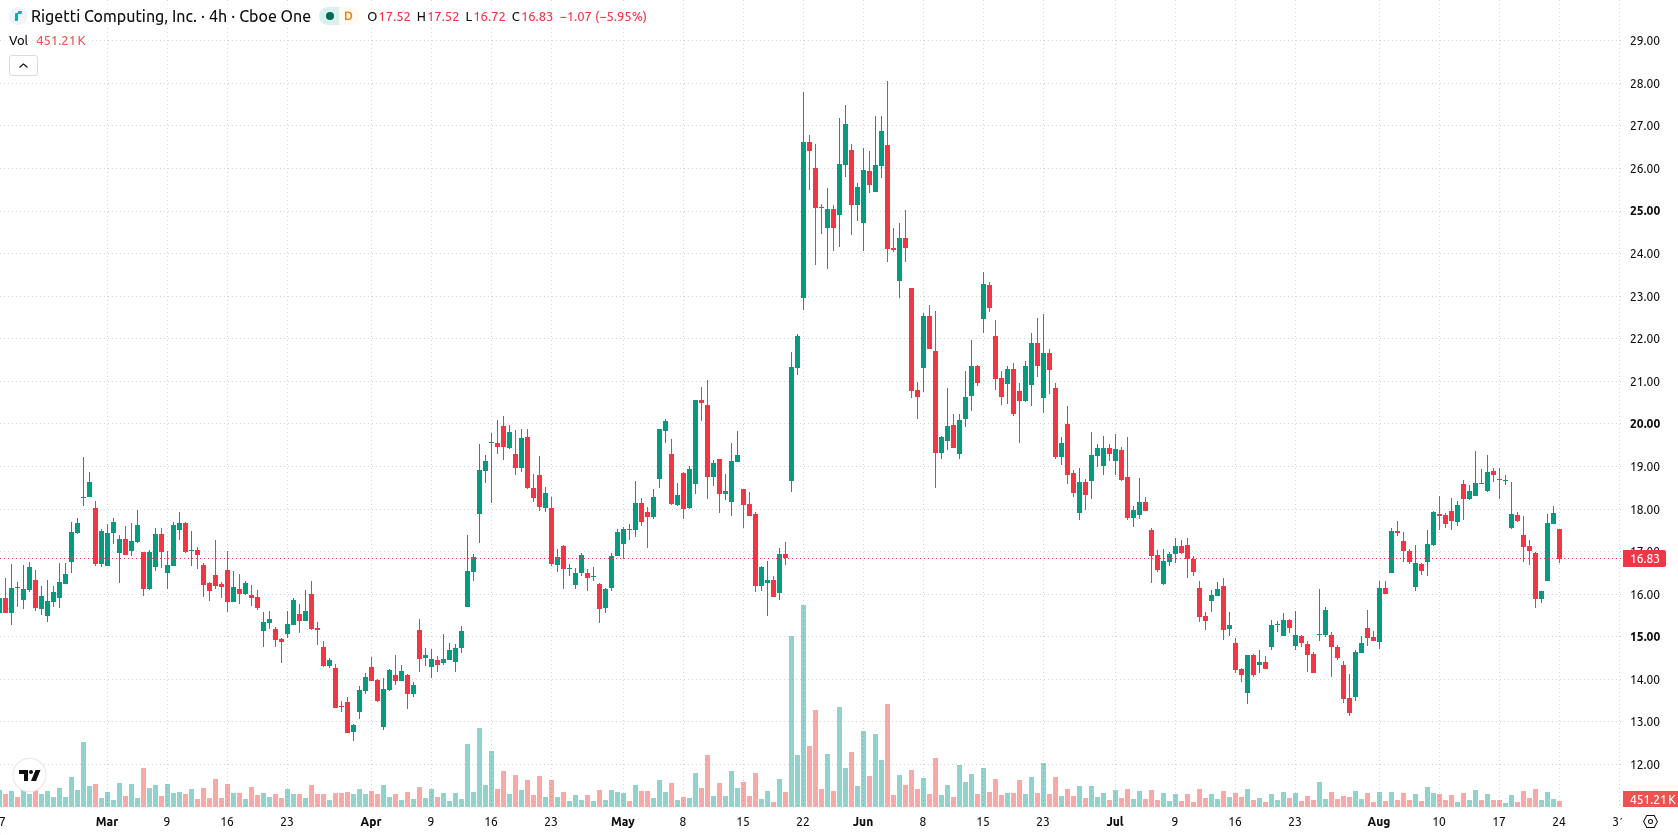
Rigetti Computing, Inc. (RGTI) fell 5.81% today, with selling pressure intensifying after an intraday downside gap and a weak open. The decline is supported by a bearish technical setup, as the stock remains below both its 50-day and 200-day moving averages.
 11.60
12.29
Highlights
- Rigetti Computing stock trades above short-term support but remains below its 50-day and 200-day averages, indicating ongoing downward pressure.
- Momentum gauges show mixed signals, with short-term bullish bias but weak trend strength and neutral oscillator readings.
- Projected five-day range is $15.38 to $18.82, with 76% probability of an upward move unless price breaks below $16.84.
Short-term support persists as bearish alignment dominates broader trend
Rigetti Computing is trading above its 20-day moving average (MA-20) at $16.84, but remains below the 50-day (MA-50) at $17.43 and the 200-day (MA-200) at $20.05. This setup points to short-term support, yet signals continued medium- and long-term pressure from sellers, in line with a bearish alignment between MA-50 and MA-200. The near-term floor is at $16.84 and the ceiling is at $17.43, with Ichimoku Kijun ($16.25) acting as additional support just under spot price. Momentum signals are mixed: the Moving Average Convergence Divergence (MACD) is bullish, but the Average Directional Index (ADX) indicates a weak trend. The Relative Strength Index (RSI) is at 53.74, suggesting a neutral-to-bullish bias without overbought risk, while the Stochastic RSI points to further room for buying. The Commodity Channel Index (CCI) and Awesome Oscillator (AO) both read neutral. Bull/Bear Power (BBP) signals buyers in control intraday, though it warns of a possible overbought condition. The stock is down $1.04 or 5.81% after opening with a downside gap of around $1.53 (about 8.54%). The price is currently near today’s low, and intraday volatility stands at 10.20%. Broadly, there is soft performance after the open, contradicting bullish momentum, with intraday sellers gaining an upper hand.
Earlier, analysts noted that Rigetti Computing was experiencing mixed technical momentum despite positive developments, with the stock remaining in a consolidative phase. The latest trading action reinforces this outlook, and with intraday volatility elevated, traders should focus closely on the ability of shares to hold above the $16.84 support level in the coming sessions.






Latest Rigetti Computing News



-
 Afghanistan
-
 Albania
-
 Algeria
-
 Angola
-
 Argentina
-
 Armenia
-
 Australia
-
 Austria
-
 Azerbaijan
-
 Bahamas
-
 Bahrain
-
 Bangladesh
-
 Belarus
-
 Belgium
-
 Bolivia
-
 Botswana
-
 Brazil
-
 Brunei
-
 Bulgaria
-
 Cambodia
-
 Cameroon
-
 Canada
-
 Chile
-
 China
-
 Colombia
-
 Congo
-
 Costa Rica
-
 Cote d'Ivoire
-
 Croatia
-
 Cuba
-
 Cyprus
-
 Czechia
-
 DR Congo
-
 Denmark
-
 Dominican Republic
-
 Ecuador
-
 Egypt
-
 El Salvador
-
 Estonia
-
 Eswatini
-
 Ethiopia
-
 Finland
-
 France
-
 Georgia
-
 Germany
-
 Ghana
-
 Greece
-
 Haiti
-
 Hong Kong
-
 Hungary
-
 India
-
 Indonesia
-
 Iran, Islamic republic
-
 Iraq
-
 Ireland
-
 Israel
-
 Italy
-
 Jamaica
-
 Japan
-
 Jordan
-
 Kazakhstan
-
 Kenya
-
 Korea
-
 Kuwait
-
 Kyrgyzstan
-
 Laos
-
 Latvia
-
 Lebanon
-
 Lesotho
-
 Libya
-
 Lithuania
-
 Luxembourg
-
 Madagascar
-
 Malaysia
-
 Malta
-
 Mauritius
-
 Mexico
-
 Moldova
-
 Mongolia
-
 Montenegro
-
 Morocco
-
 Mozambique
-
 Myanmar
-
 Namibia
-
 Nepal
-
 Netherlands
-
 New Zealand
-
 Nigeria
-
 North Macedonia
-
 Norway
-
 Oman
-
 Pakistan
-
 Palestine
-
 Panama
-
 Papua New Guinea
-
 Paraguay
-
 Peru
-
 Philippines
-
 Poland
-
 Portugal
-
 Puerto Rico
-
 Qatar
-
 Reunion
-
 Romania
-
 Rwanda
-
 Saudi Arabia
-
 Serbia
-
 Singapore
-
 Slovakia
-
 Slovenia
-
 Somalia
-
 South Africa
-
 Spain
-
 Sri Lanka
-
 Sweden
-
 Switzerland
-
 Syria
-
 Taiwan
-
 Tajikistan
-
 Tanzania
-
 Thailand
-
 Trinidad and Tobago
-
 Tunisia
-
 Turkey
-
 UAE
-
 Uganda
-
 Ukraine
-
 United Kingdom
-
United States
-
 Uruguay
-
 Uzbekistan
-
 Venezuela
-
 Vietnam
-
 Yemen
-
 Zambia
-
 Zimbabwe
- Forex
- Crypto












