

Home Depot shares weekly forecast: Range bound near resistance as volatility stays elevated

Shares of Home Depot, Inc (HD) are trading near $340 after climbing about 1% this week, with sellers keeping pressure despite the move. Solid earnings and a consistent dividend underpin HD's setup as the market weighs cost concerns and executive changes heading into the new week.
 346.64
355.35
Highlights
- Shares of Home Depot rose to $339.81 over the past week, but the longer-term trend remains bearish as the stock trades below major daily moving averages.
- Momentum signals are mixed, with the daily trend flat and volatility contained within a narrow range.
- The base case expects trading between $330.99 and $348.62, with major resistance near $340.06 and key support at $330.69.
Earnings beat and dividend lift sentiment as CEO takes medical leave
Home Depot reported fiscal second-quarter revenue of $47.86–$47.9 billion and net income of nearly $4.77 billion, both ahead of Wall Street expectations according to CNBC and PR Newswire. The company also declared a quarterly cash dividend of $2.33 per share, payable on September 17, 2026, reinforcing its reliable payout. Management reaffirmed its full-year outlook despite a soft housing environment and ongoing cost pressures, while CEO Edward Decker temporarily stepped aside for medical leave.
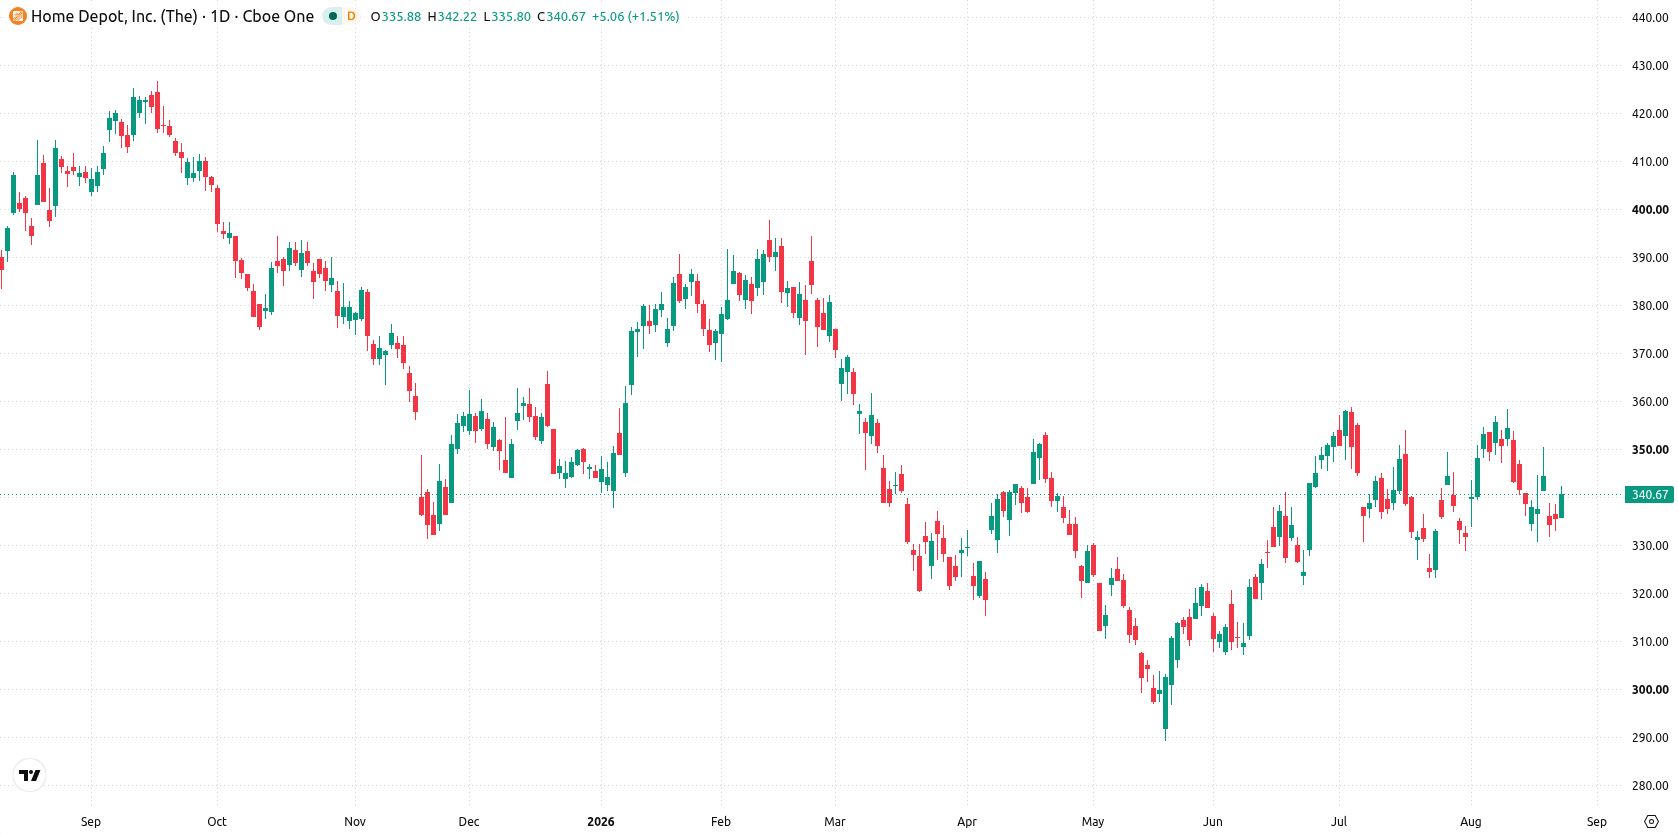
Mixed momentum over the week keeps price confined in narrow range
The daily setup shows a flat trend with a contained move within a narrow range, as volatility over the past week reached 5.96%. RSI sits at 46.05 in the neutral zone, while Stochastic RSI is firmly oversold at 6.08, highlighting mixed momentum conditions. The nearest support is at $330.69, and the nearest resistance is $340.06, which coincides with the MA-50, while the Ichimoku Kijun at $340.71 also acts as a resistance level. This setup signals that price action is likely to remain capped unless momentum meaningfully shifts.
Range-bound trade favored as resistance caps upside for next week
In the week ahead, the expected range is $330.99 to $348.62. There is a 28% probability of an increase and a 72% probability of a decrease. The base case favors trading contained within this range, with major resistance at $340.06 capping any advances. A push above $340.71 would open up the bullish scenario towards the upper end of the range. A break below $330.69 support would signal further downside.
Earlier, analysts noted that persistent selling pressure and bearish momentum continued to dominate Home Depot's price action despite strong earnings results. The current technical setup suggests traders should monitor the $340.71 resistance level closely, as a sustained breakout above this point could signal a shift toward near-term upside.






Latest Home Depot News




-
 Afghanistan
-
 Albania
-
 Algeria
-
 Angola
-
 Argentina
-
 Armenia
-
 Australia
-
 Austria
-
 Azerbaijan
-
 Bahamas
-
 Bahrain
-
 Bangladesh
-
 Belarus
-
 Belgium
-
 Bolivia
-
 Botswana
-
 Brazil
-
 Brunei
-
 Bulgaria
-
 Cambodia
-
 Cameroon
-
 Canada
-
 Chile
-
 China
-
 Colombia
-
 Congo
-
 Costa Rica
-
 Cote d'Ivoire
-
 Croatia
-
 Cuba
-
 Cyprus
-
 Czechia
-
 DR Congo
-
 Denmark
-
 Dominican Republic
-
 Ecuador
-
 Egypt
-
 El Salvador
-
 Estonia
-
 Eswatini
-
 Ethiopia
-
 Finland
-
 France
-
 Georgia
-
 Germany
-
 Ghana
-
 Greece
-
 Haiti
-
 Hong Kong
-
 Hungary
-
 India
-
 Indonesia
-
 Iran, Islamic republic
-
 Iraq
-
 Ireland
-
 Israel
-
 Italy
-
 Jamaica
-
 Japan
-
 Jordan
-
 Kazakhstan
-
 Kenya
-
 Korea
-
 Kuwait
-
 Kyrgyzstan
-
 Laos
-
 Latvia
-
 Lebanon
-
 Lesotho
-
 Libya
-
 Lithuania
-
 Luxembourg
-
 Madagascar
-
 Malaysia
-
 Malta
-
 Mauritius
-
 Mexico
-
 Moldova
-
 Mongolia
-
 Montenegro
-
 Morocco
-
 Mozambique
-
 Myanmar
-
 Namibia
-
 Nepal
-
 Netherlands
-
 New Zealand
-
 Nigeria
-
 North Macedonia
-
 Norway
-
 Oman
-
 Pakistan
-
 Palestine
-
 Panama
-
 Papua New Guinea
-
 Paraguay
-
 Peru
-
 Philippines
-
 Poland
-
 Portugal
-
 Puerto Rico
-
 Qatar
-
 Reunion
-
 Romania
-
 Rwanda
-
 Saudi Arabia
-
 Serbia
-
 Singapore
-
 Slovakia
-
 Slovenia
-
 Somalia
-
 South Africa
-
 Spain
-
 Sri Lanka
-
 Sweden
-
 Switzerland
-
 Syria
-
 Taiwan
-
 Tajikistan
-
 Tanzania
-
 Thailand
-
 Trinidad and Tobago
-
 Tunisia
-
 Turkey
-
 UAE
-
 Uganda
-
 Ukraine
-
 United Kingdom
-
United States
-
 Uruguay
-
 Uzbekistan
-
 Venezuela
-
 Vietnam
-
 Yemen
-
 Zambia
-
 Zimbabwe
- Forex
- Crypto












