

Why is Home Depot stock down today? Support levels in focus

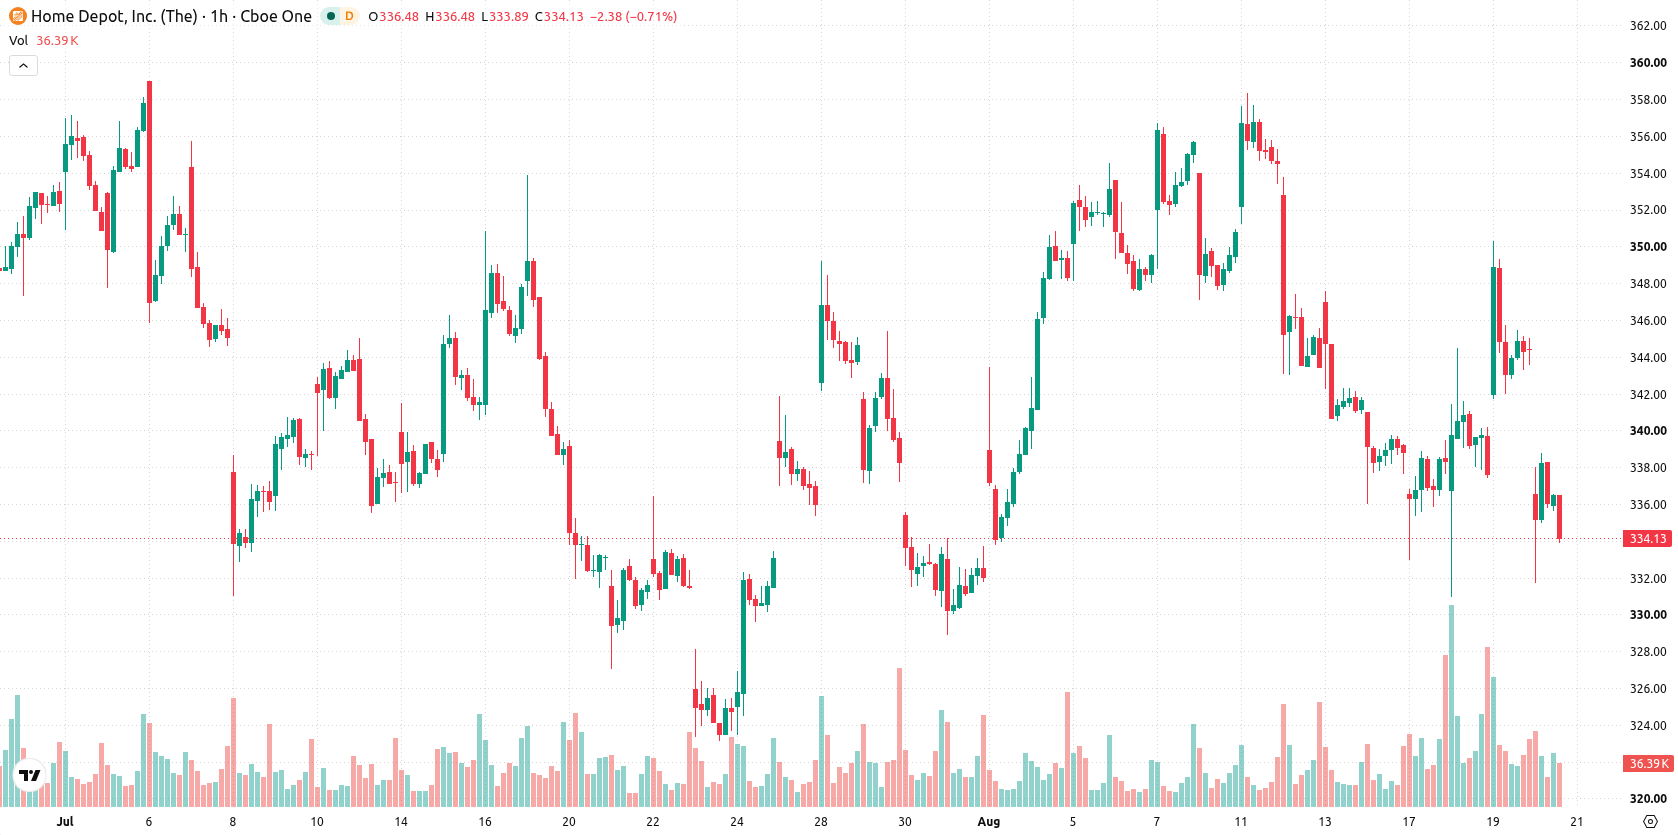
Home Depot (HD) stock is trading at $333.83, down 3.07% on the day and holding near session lows. The price remains below its key moving averages, reflecting clear negative momentum.
 349.34
356.88
Highlights
- Home Depot reported Q2 2026 adjusted earnings of $4.92 per share and revenue of $47.86 billion, both above analyst expectations.
- Comparable sales increased 1.7%, online sales rose 11%, and the company now offers nationwide express delivery in all U.S. markets.
- Shares of Home Depot fell 3.07% to $333.83 as technical indicators confirm strong selling pressure with a likely price range of $325.11 to $342.55 in the next few days.
Growth outpaces estimates as price action resists positive results
Home Depot reported fiscal second-quarter 2026 results that surpassed Wall Street expectations, posting adjusted earnings of $4.92 per share and revenue of $47.86 billion, according to Investing.com. This performance reflected underlying strength, with comparable sales increasing by 1.7% and online sales up 11%, while the company reaffirmed its full-year outlook. In addition, Home Depot introduced nationwide express delivery across all U.S. markets, enhancing its logistics capabilities and positioning for future growth. The company also recorded Q2 2026 sales of $47.9 billion, a 5.7% increase over the prior year, as reported by Retail Customer Experience, though price action has remained under broader selling pressure.
Oversold technicals deepen as bearish momentum intensifies below resistance
Technically, HD is trading below the MA-20, MA-50, and MA-200 on the working timeframe. Immediate resistance is defined by the Ichimoku Kijun at $340.54. Bearish momentum is confirmed by the MACD and ADX, both showing persistent selling. The RSI stands at 39, and CCI, Stochastic RSI, and Bull/Bear Power remain deeply in oversold or seller-favored territory. Awesome Oscillator readings are also consistent with the prevailing downtrend.
Downside risk prevails as consolidation narrows between support and resistance
Over the next 2–3 trading days, HD is expected to range between $325.11 and $342.55. The probability of an upward move is considered very low, while a downward break through the lower boundary is highly likely. The baseline scenario anticipates consolidation within these levels, with a potential bullish reversal only if price breaks above resistance at the Ichimoku Kijun. A move below $325.11 would open the way for further selling momentum.
Earlier, analysts noted that Home Depot remained under sustained selling pressure, with technical signals pointing to ongoing bearish control despite robust earnings results. The latest price action and persistently negative momentum indicators confirm this assessment, with traders advised to monitor $325.11 as the next critical support level for potential downside continuation.









-
 Afghanistan
-
 Albania
-
 Algeria
-
 Angola
-
 Argentina
-
 Armenia
-
 Australia
-
 Austria
-
 Azerbaijan
-
 Bahamas
-
 Bahrain
-
 Bangladesh
-
 Belarus
-
 Belgium
-
 Bolivia
-
 Botswana
-
 Brazil
-
 Brunei
-
 Bulgaria
-
 Cambodia
-
 Cameroon
-
 Canada
-
 Chile
-
 China
-
 Colombia
-
 Congo
-
 Costa Rica
-
 Cote d'Ivoire
-
 Croatia
-
 Cuba
-
 Cyprus
-
 Czechia
-
 DR Congo
-
 Denmark
-
 Dominican Republic
-
 Ecuador
-
 Egypt
-
 El Salvador
-
 Estonia
-
 Eswatini
-
 Ethiopia
-
 Finland
-
 France
-
 Georgia
-
 Germany
-
 Ghana
-
 Greece
-
 Haiti
-
 Hong Kong
-
 Hungary
-
 India
-
 Indonesia
-
 Iran, Islamic republic
-
 Iraq
-
 Ireland
-
 Israel
-
 Italy
-
 Jamaica
-
 Japan
-
 Jordan
-
 Kazakhstan
-
 Kenya
-
 Korea
-
 Kuwait
-
 Kyrgyzstan
-
 Laos
-
 Latvia
-
 Lebanon
-
 Lesotho
-
 Libya
-
 Lithuania
-
 Luxembourg
-
 Madagascar
-
 Malaysia
-
 Malta
-
 Mauritius
-
 Mexico
-
 Moldova
-
 Mongolia
-
 Montenegro
-
 Morocco
-
 Mozambique
-
 Myanmar
-
 Namibia
-
 Nepal
-
 Netherlands
-
 New Zealand
-
 Nigeria
-
 North Macedonia
-
 Norway
-
 Oman
-
 Pakistan
-
 Palestine
-
 Panama
-
 Papua New Guinea
-
 Paraguay
-
 Peru
-
 Philippines
-
 Poland
-
 Portugal
-
 Puerto Rico
-
 Qatar
-
 Reunion
-
 Romania
-
 Rwanda
-
 Saudi Arabia
-
 Serbia
-
 Singapore
-
 Slovakia
-
 Slovenia
-
 Somalia
-
 South Africa
-
 Spain
-
 Sri Lanka
-
 Sweden
-
 Switzerland
-
 Syria
-
 Taiwan
-
 Tajikistan
-
 Tanzania
-
 Thailand
-
 Trinidad and Tobago
-
 Tunisia
-
 Turkey
-
 UAE
-
 Uganda
-
 Ukraine
-
 United Kingdom
-
United States
-
 Uruguay
-
 Uzbekistan
-
 Venezuela
-
 Vietnam
-
 Yemen
-
 Zambia
-
 Zimbabwe
- Forex
- Crypto












