

SMMT slides around 6.5% as stock remains below key moving averages with weak momentum

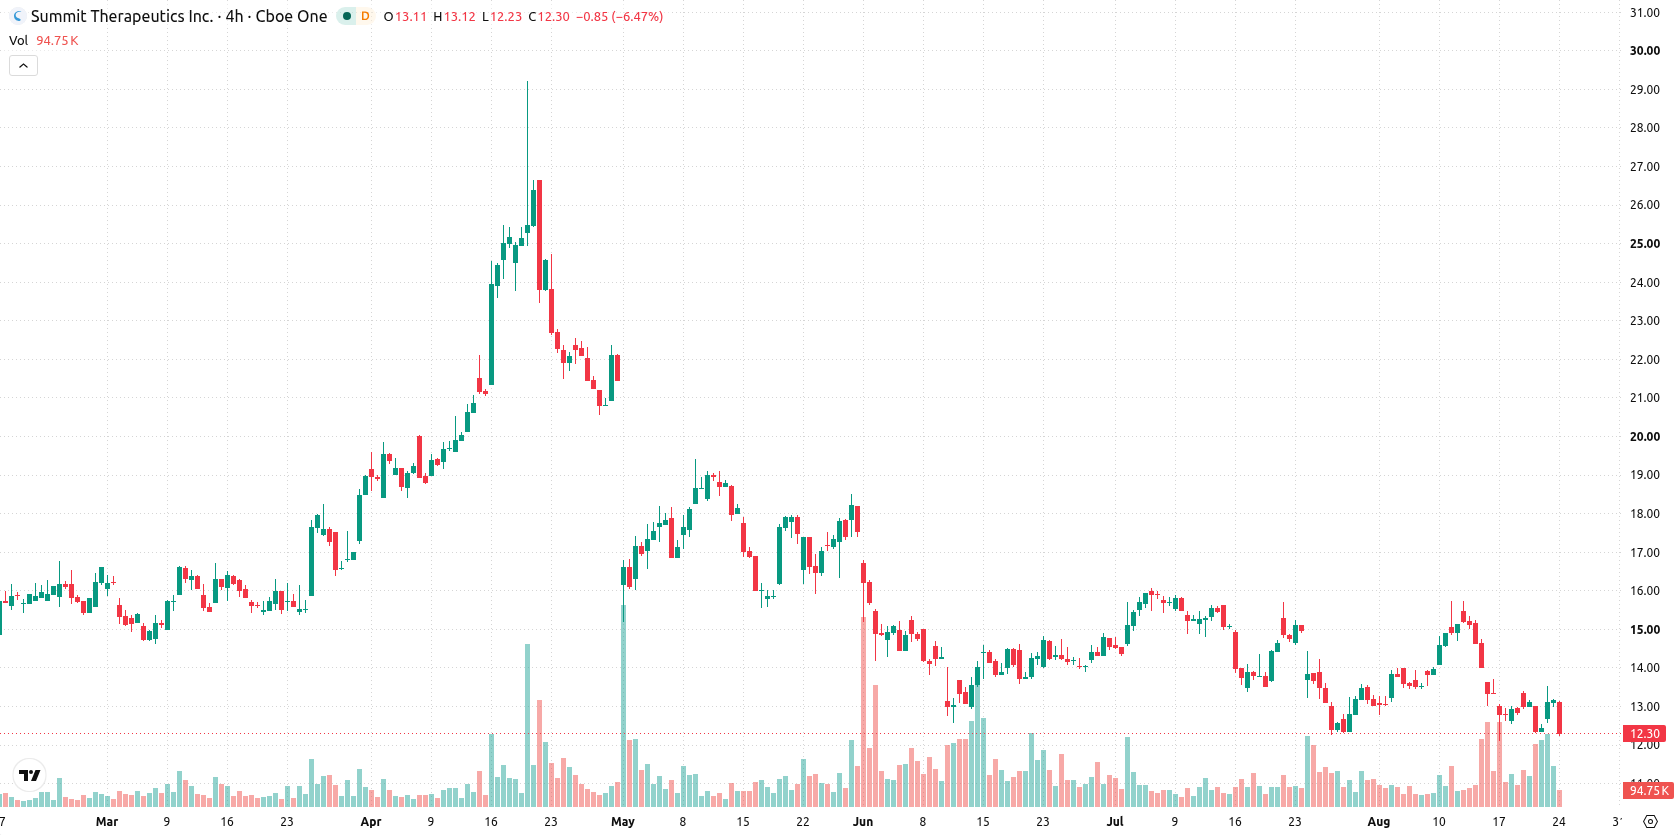
Summit Therapeutics (SMMT) slid 6.46% under sharp selling pressure, as technical momentum signaled a continuation of its recent decline in the absence of a fresh catalyst. The downtrend is reinforced by the stock remaining below its 20-, 50-, and 200-day moving averages, with weak momentum and persistent resistance levels supporting the downside move.
 16.38
16.52
Highlights
- Shares of Summit Therapeutics trade below key moving averages with persistent selling pressure across all timeframes.
- Momentum indicators trend weak with negative MACD and RSI in selling territory, but select oscillators show oversold conditions.
- The expected 5-day price range is $11.7 to $12.93, with 65% probability for a downward move and 35% for an upward move.
Mixed momentum signals as oversold conditions collide with resistance
Summit Therapeutics is currently trading below its 20-day ($13.47), 50-day ($14.1), and 200-day ($16.59) moving averages, indicating ongoing pressure from sellers across short-, medium-, and long-term trends. The Ichimoku Kijun at $13.91 acts as distant resistance, with a near-term ceiling at $12.6 and nearest floor at $12.29. Momentum remains weak as the MACD signals sell, while the ADX is neutral. The RSI stands at 45.1, indicating selling pressure. Stochastic RSI and Hull Moving Average (HMA) show strong buy signals, revealing a divergence between momentum and oversold oscillators. Bull/Bear Power (BBP) is mildly positive at 0.11, pointing to intraday buyer activity mixed with oversold conditions. The CCI and Awesome Oscillator both read neutral. The stock opened with a downside gap of about 3.57% and is near the day's low, with intraday volatility at 7.30%. Intraday tone shows clear selling pressure with weak momentum.
Earlier, analysts noted that Summit Therapeutics was facing sustained downside pressure as technical weakness and persistent selling dominated its trading pattern. The latest price action reinforces this bearish scenario, with the key risk now focused on a potential breakdown below the $12.29 support that could open the door to further declines toward $11.7.






Latest Summit Therapeutics News





-
 Afghanistan
-
 Albania
-
 Algeria
-
 Angola
-
 Argentina
-
 Armenia
-
 Australia
-
 Austria
-
 Azerbaijan
-
 Bahamas
-
 Bahrain
-
 Bangladesh
-
 Belarus
-
 Belgium
-
 Bolivia
-
 Botswana
-
 Brazil
-
 Brunei
-
 Bulgaria
-
 Cambodia
-
 Cameroon
-
 Canada
-
 Chile
-
 China
-
 Colombia
-
 Congo
-
 Costa Rica
-
 Cote d'Ivoire
-
 Croatia
-
 Cuba
-
 Cyprus
-
 Czechia
-
 DR Congo
-
 Denmark
-
 Dominican Republic
-
 Ecuador
-
 Egypt
-
 El Salvador
-
 Estonia
-
 Eswatini
-
 Ethiopia
-
 Finland
-
 France
-
 Georgia
-
 Germany
-
 Ghana
-
 Greece
-
 Haiti
-
 Hong Kong
-
 Hungary
-
 India
-
 Indonesia
-
 Iran, Islamic republic
-
 Iraq
-
 Ireland
-
 Israel
-
 Italy
-
 Jamaica
-
 Japan
-
 Jordan
-
 Kazakhstan
-
 Kenya
-
 Korea
-
 Kuwait
-
 Kyrgyzstan
-
 Laos
-
 Latvia
-
 Lebanon
-
 Lesotho
-
 Libya
-
 Lithuania
-
 Luxembourg
-
 Madagascar
-
 Malaysia
-
 Malta
-
 Mauritius
-
 Mexico
-
 Moldova
-
 Mongolia
-
 Montenegro
-
 Morocco
-
 Mozambique
-
 Myanmar
-
 Namibia
-
 Nepal
-
 Netherlands
-
 New Zealand
-
 Nigeria
-
 North Macedonia
-
 Norway
-
 Oman
-
 Pakistan
-
 Palestine
-
 Panama
-
 Papua New Guinea
-
 Paraguay
-
 Peru
-
 Philippines
-
 Poland
-
 Portugal
-
 Puerto Rico
-
 Qatar
-
 Reunion
-
 Romania
-
 Rwanda
-
 Saudi Arabia
-
 Serbia
-
 Singapore
-
 Slovakia
-
 Slovenia
-
 Somalia
-
 South Africa
-
 Spain
-
 Sri Lanka
-
 Sweden
-
 Switzerland
-
 Syria
-
 Taiwan
-
 Tajikistan
-
 Tanzania
-
 Thailand
-
 Trinidad and Tobago
-
 Tunisia
-
 Turkey
-
 UAE
-
 Uganda
-
 Ukraine
-
 United Kingdom
-
United States
-
 Uruguay
-
 Uzbekistan
-
 Venezuela
-
 Vietnam
-
 Yemen
-
 Zambia
-
 Zimbabwe
- Forex
- Crypto












