

What's behind eToro's latest 3.0% stock pullback?

Technical selling pressure drove eToro Group Ltd (ETOR) down 2.97% today as the absence of fresh catalysts left sellers in control. A clear bearish tone is reinforced by the stock trading well below its 20-day, 50-day, and 200-day moving averages, highlighting persistent downward momentum across all time frames.
 22.94
23.69
Highlights
- Shares of eToro trade below their 20-day, 50-day, and 200-day moving averages, with price action near the session low.
- Technical indicators such as RSI and MACD show bearish signals, and the stock fell 2.97% to $29.42 today.
- Key resistance is at $29.87 and support at $27.71, with an expected five-day range of $27.71 to $31.13 and a 65% probability of further downside.
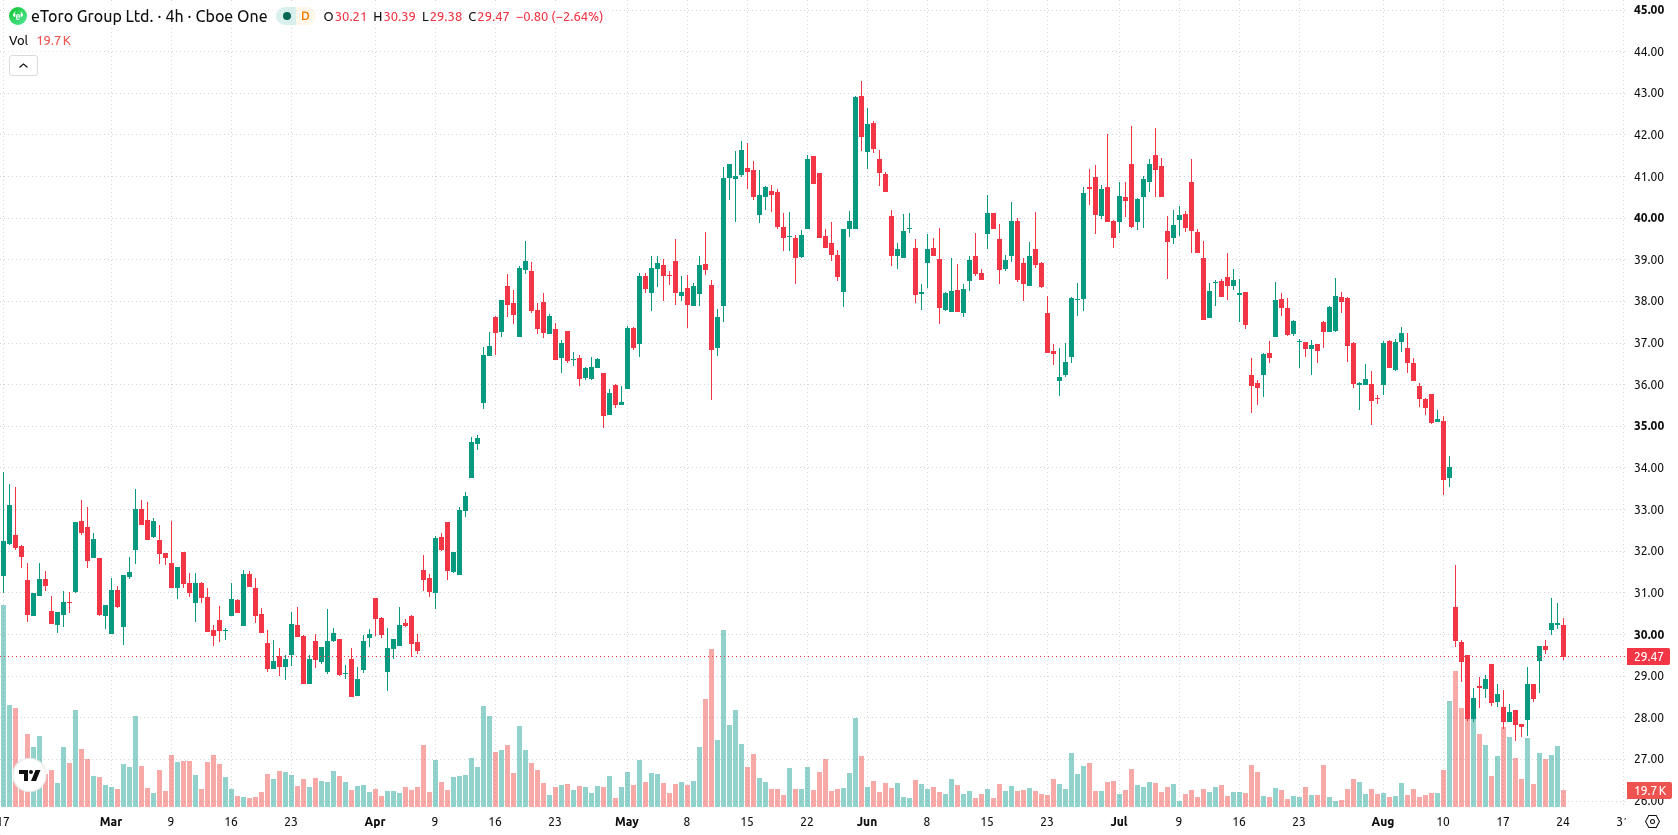
Bearish short-term signals as eToro stays below key technical levels
eToro is positioned below its 20-day, 50-day, and 200-day moving averages at $32.89, $36.36, and $35.24, confirming sustained downward pressure. The immediate resistance is set at $29.87 with support at $27.71, while the longer-term trend structure is still viewed as bullish. Short-term indicators remain bearish: the RSI is at 37.74 with a sell signal suggesting oversold territory, and MACD also signals a sell. The ADX at 18.55 shows trend weakness. Both the Stochastic RSI and CCI are neutral, while intraday Bull/Bear Power at 0.03 hints at buyer activity but still reflects oversold pressure. The Awesome Oscillator is neutral, with mixed signals intraday as sellers dominate early trading but some indicators hint at limited buying interest.
Earlier, analysts noted that eToro shares were shifting toward a more balanced technical outlook, with consolidation as the prevailing theme and directional bias hinging on future breakout signals. The latest technical data signals a meaningful shift to bearish momentum, making a sustained move below $27.71 a critical downside risk to monitor in the coming sessions.











-
 Afghanistan
-
 Albania
-
 Algeria
-
 Angola
-
 Argentina
-
 Armenia
-
 Australia
-
 Austria
-
 Azerbaijan
-
 Bahamas
-
 Bahrain
-
 Bangladesh
-
 Belarus
-
 Belgium
-
 Bolivia
-
 Botswana
-
 Brazil
-
 Brunei
-
 Bulgaria
-
 Cambodia
-
 Cameroon
-
 Canada
-
 Chile
-
 China
-
 Colombia
-
 Congo
-
 Costa Rica
-
 Cote d'Ivoire
-
 Croatia
-
 Cuba
-
 Cyprus
-
 Czechia
-
 DR Congo
-
 Denmark
-
 Dominican Republic
-
 Ecuador
-
 Egypt
-
 El Salvador
-
 Estonia
-
 Eswatini
-
 Ethiopia
-
 Finland
-
 France
-
 Georgia
-
 Germany
-
 Ghana
-
 Greece
-
 Haiti
-
 Hong Kong
-
 Hungary
-
 India
-
 Indonesia
-
 Iran, Islamic republic
-
 Iraq
-
 Ireland
-
 Israel
-
 Italy
-
 Jamaica
-
 Japan
-
 Jordan
-
 Kazakhstan
-
 Kenya
-
 Korea
-
 Kuwait
-
 Kyrgyzstan
-
 Laos
-
 Latvia
-
 Lebanon
-
 Lesotho
-
 Libya
-
 Lithuania
-
 Luxembourg
-
 Madagascar
-
 Malaysia
-
 Malta
-
 Mauritius
-
 Mexico
-
 Moldova
-
 Mongolia
-
 Montenegro
-
 Morocco
-
 Mozambique
-
 Myanmar
-
 Namibia
-
 Nepal
-
 Netherlands
-
 New Zealand
-
 Nigeria
-
 North Macedonia
-
 Norway
-
 Oman
-
 Pakistan
-
 Palestine
-
 Panama
-
 Papua New Guinea
-
 Paraguay
-
 Peru
-
 Philippines
-
 Poland
-
 Portugal
-
 Puerto Rico
-
 Qatar
-
 Reunion
-
 Romania
-
 Rwanda
-
 Saudi Arabia
-
 Serbia
-
 Singapore
-
 Slovakia
-
 Slovenia
-
 Somalia
-
 South Africa
-
 Spain
-
 Sri Lanka
-
 Sweden
-
 Switzerland
-
 Syria
-
 Taiwan
-
 Tajikistan
-
 Tanzania
-
 Thailand
-
 Trinidad and Tobago
-
 Tunisia
-
 Turkey
-
 UAE
-
 Uganda
-
 Ukraine
-
 United Kingdom
-
United States
-
 Uruguay
-
 Uzbekistan
-
 Venezuela
-
 Vietnam
-
 Yemen
-
 Zambia
-
 Zimbabwe
- Forex
- Crypto












