

eToro stock price prediction: Downward momentum persists as sellers dominate

eToro (ETOR) stock is trading at $20.88, down 4.4% on the day. The price remains below its key short- and long-term moving averages, signaling continued downside momentum.
 21.76
23.07
Highlights
- eToro Group stock fell after Q3 2026 adjusted EBITDA dropped 56% to $34 million, exposing sharply reduced profitability.
- Net contribution declined 13% year over year to $186 million and eToro announced a second round of layoffs in 2026 and a $250 million share repurchase program.
- Shares trade below key moving averages and technical indicators register persistent bearish signals, with the expected range at $20.18 to $21.58.
Profitability pressures mount as cost cuts and buybacks seek to stabilize sentiment
EToro Group Ltd. (NASDAQ:ETOR) reported weaker-than-expected Q3 2026 results, registering adjusted diluted EPS of $0.26 and a 13% year-over-year decline in net contribution to $186 million. According to the company, adjusted EBITDA dropped 56% to $34 million during the quarter, reflecting sharply reduced profitability and pressuring investor sentiment. Additional cost reductions included a second round of global layoffs in 2026, following a 7% workforce reduction earlier in the year, while a $250 million share repurchase program was introduced on November 10 to provide some offsetting support for per-share metrics. Despite slightly surpassing revenue forecasts with Q3 revenue of $197.02 million, results underscored ongoing operational and profitability challenges, contributing to the stock's downward pressure.
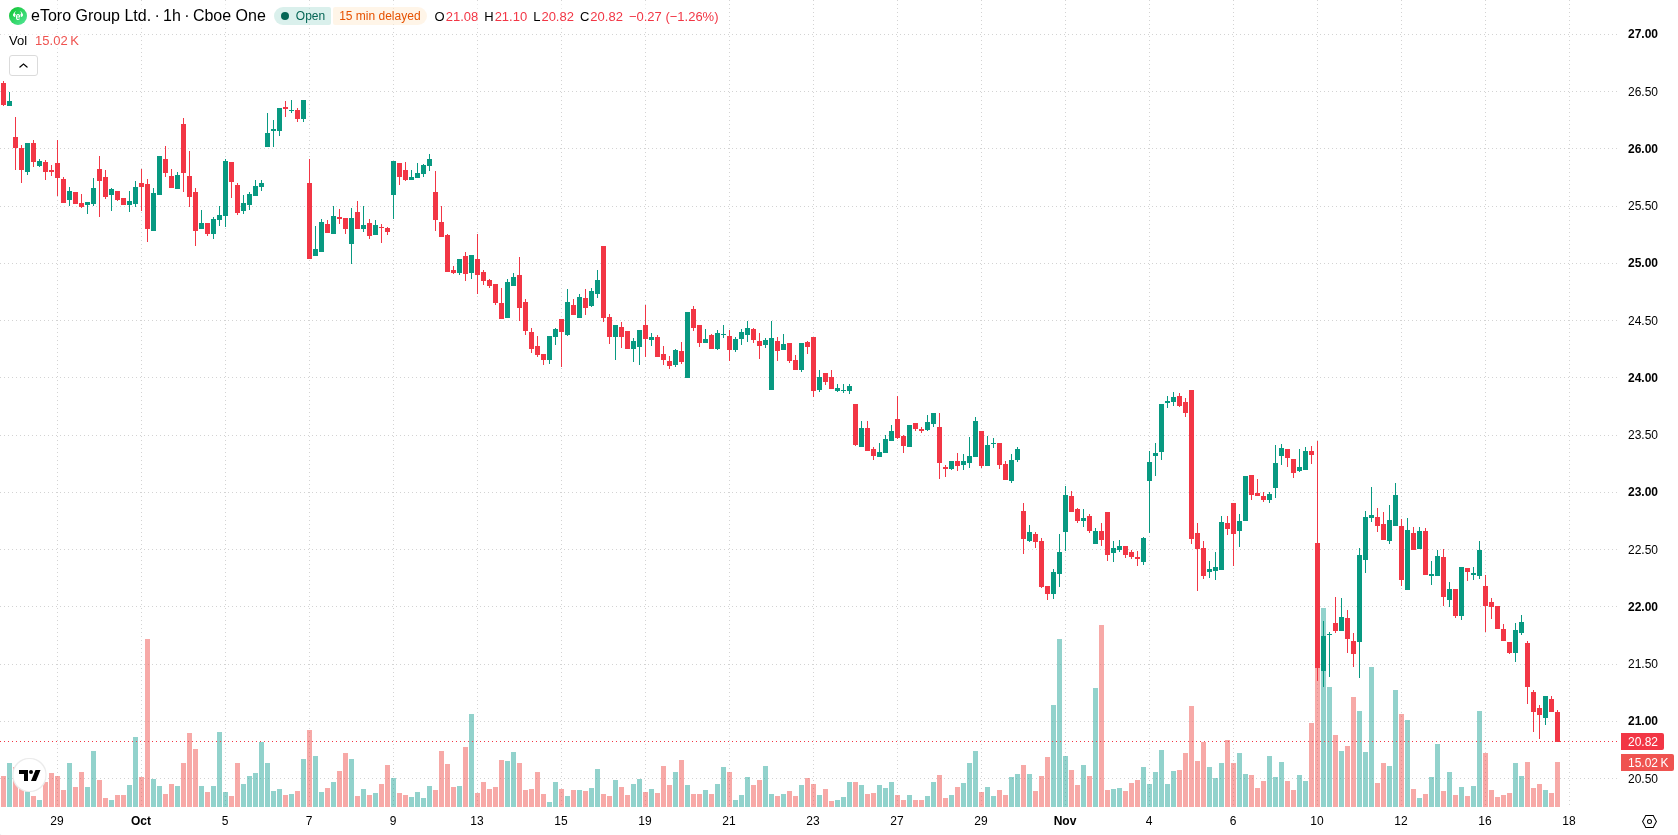
Sustained bearish momentum as oversold signals fail to spark reversal
On the hourly chart, ETOR is trading below the H1 SMA-20 at $21.82 and H1 SMA-50 at $22.27, as well as the D1 SMA-200 at $32.29. The Ichimoku Kijun at $21.81 marks immediate resistance. Momentum indicators show persistent weakness: MACD and ADX both signal sell conditions, while RSI remains neutral. Stochastic RSI and CCI are in the oversold zone, which highlights potential selling exhaustion even if not signaling a definitive reversal. Bull/Bear Power indicates sustained selling dominance, with a negative value of -0.32, and the Awesome Oscillator issues a Sell signal, reinforcing the overall bearish technical outlook.
Rangebound consolidation likely as resistance caps rebound prospects
Over the next several sessions, ETOR is expected to trade within a range of $20.18 to $21.58, reflecting typical volatility following the recent decline. The baseline scenario calls for consolidation within this corridor. An upward move remains unlikely unless the price decisively breaks above immediate resistance at the Ichimoku Kijun. Failure to hold current support could lead to another leg down in the short term.
Earlier, analysts noted that eToro was exhibiting persistent technical weakness and elevated downside risk amid ongoing operational challenges. The current pattern of downside momentum and oversold technical signals supports a prevailing scenario of consolidation within a narrow range, with a decisive move below current support presenting the next key risk for traders to monitor.










-
 Afghanistan
-
 Albania
-
 Algeria
-
 Angola
-
 Argentina
-
 Armenia
-
 Australia
-
 Austria
-
 Azerbaijan
-
 Bahamas
-
 Bahrain
-
 Bangladesh
-
 Belarus
-
 Belgium
-
 Bolivia
-
 Botswana
-
 Brazil
-
 Brunei
-
 Bulgaria
-
 Cambodia
-
 Cameroon
-
 Canada
-
 Chile
-
 China
-
 Colombia
-
 Congo
-
 Costa Rica
-
 Cote d'Ivoire
-
 Croatia
-
 Cuba
-
 Cyprus
-
 Czechia
-
 DR Congo
-
 Denmark
-
 Dominican Republic
-
 Ecuador
-
 Egypt
-
 El Salvador
-
 Estonia
-
 Eswatini
-
 Ethiopia
-
 Finland
-
 France
-
 Georgia
-
 Germany
-
 Ghana
-
 Greece
-
 Haiti
-
 Hong Kong
-
 Hungary
-
 India
-
 Indonesia
-
 Iran, Islamic republic
-
 Iraq
-
 Ireland
-
 Israel
-
 Italy
-
 Jamaica
-
 Japan
-
 Jordan
-
 Kazakhstan
-
 Kenya
-
 Korea
-
 Kuwait
-
 Kyrgyzstan
-
 Laos
-
 Latvia
-
 Lebanon
-
 Lesotho
-
 Libya
-
 Lithuania
-
 Luxembourg
-
 Madagascar
-
 Malaysia
-
 Malta
-
 Mauritius
-
 Mexico
-
 Moldova
-
 Mongolia
-
 Montenegro
-
 Morocco
-
 Mozambique
-
 Myanmar
-
 Namibia
-
 Nepal
-
 Netherlands
-
 New Zealand
-
 Nigeria
-
 North Macedonia
-
 Norway
-
 Oman
-
 Pakistan
-
 Palestine
-
 Panama
-
 Papua New Guinea
-
 Paraguay
-
 Peru
-
 Philippines
-
 Poland
-
 Portugal
-
 Puerto Rico
-
 Qatar
-
 Reunion
-
 Romania
-
 Rwanda
-
 Saudi Arabia
-
 Serbia
-
 Singapore
-
 Slovakia
-
 Slovenia
-
 Somalia
-
 South Africa
-
 Spain
-
 Sri Lanka
-
 Sweden
-
 Switzerland
-
 Syria
-
 Taiwan
-
 Tajikistan
-
 Tanzania
-
 Thailand
-
 Trinidad and Tobago
-
 Tunisia
-
 Turkey
-
 UAE
-
 Uganda
-
 Ukraine
-
 United Kingdom
-
United States
-
 Uruguay
-
 Uzbekistan
-
 Venezuela
-
 Vietnam
-
 Yemen
-
 Zambia
-
 Zimbabwe
- Forex
- Crypto












