

What's behind Enphase Energy's latest 3.8% stock pullback?

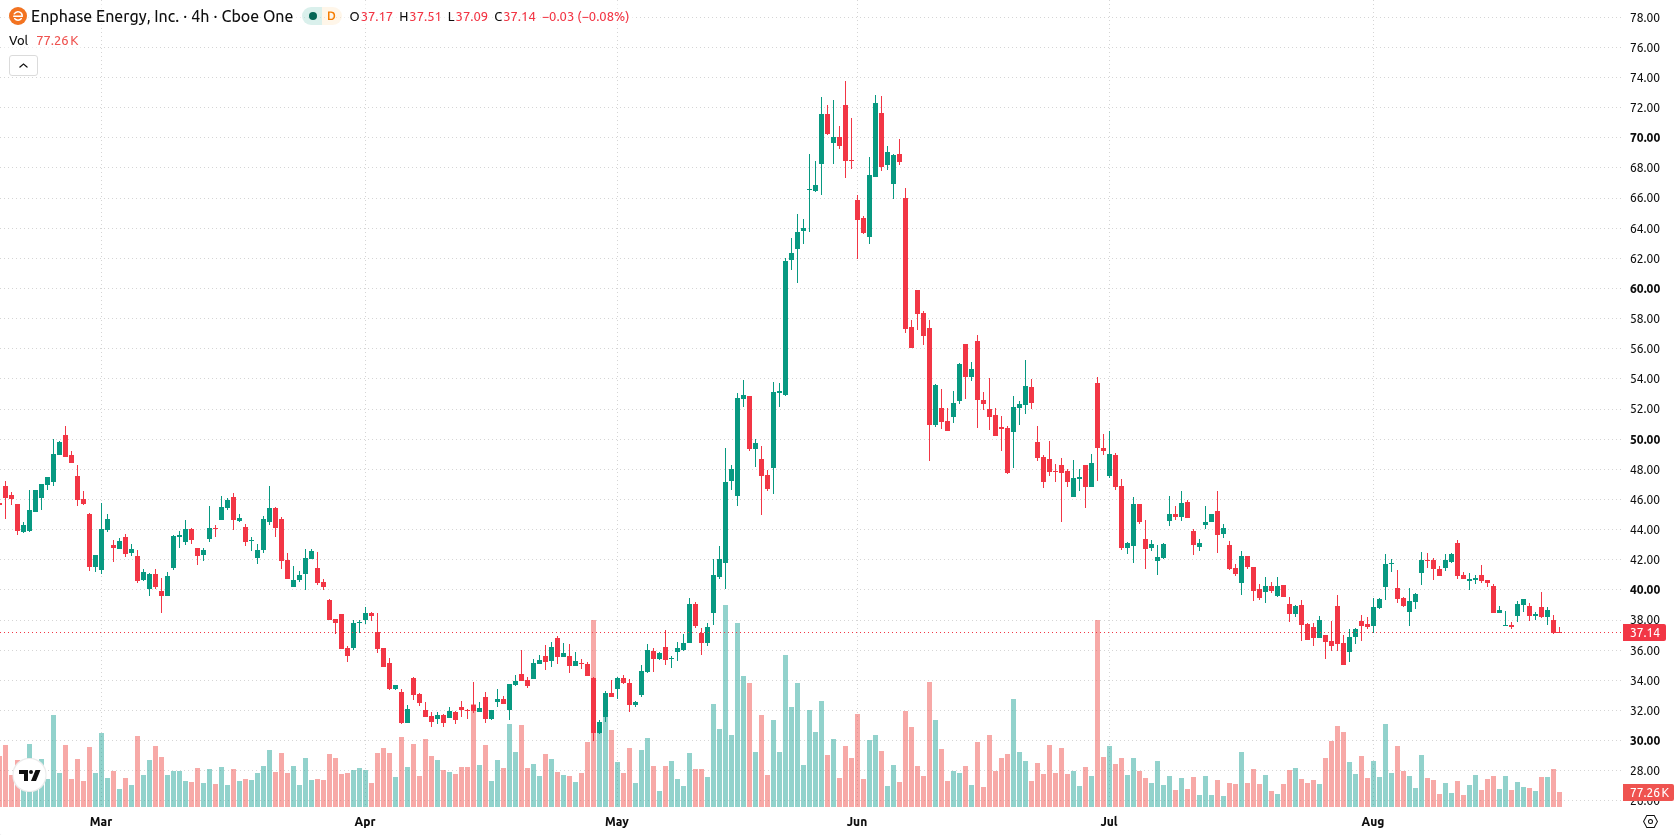
Enphase Energy, Inc. (ENPH) came under renewed selling pressure with a 3.77% decline, as technical momentum and persistent bearish signals triggered a slide across all timeframes. The move is strongly supported by the stock trading below its 20-day, 50-day, and 200-day moving averages, confirming broad downside momentum.
 32.35
33.49
32.35
33.49
Highlights
- Shares of Enphase Energy closed at $37.16, down 3.77% and near the session low, under sustained selling pressure.
- The stock trades below short- and long-term moving averages and technical indicator signals remain predominantly negative.
- The projected range for the next five sessions is $35.83 to $38.39, with a 79% probability of further downside.
Multiple sell signals as bearish momentum meets key support
Enphase Energy is trading below its 20-day, 50-day, and 200-day moving averages ($39.19, $43.11, and $40.40 respectively), highlighting pressure from sellers across all timeframes. Immediate support is at $37.10, and the nearest ceiling is at the recent week low of $37.34. More distant moving average and Ichimoku levels confirm the prevailing bearish trend. Momentum signals are mostly negative: MACD signals "Strong Sell," the Average Directional Index (ADX) is neutral at low strength, and the Relative Strength Index (RSI) at 44.57 also indicates "Sell" without showing oversold risk. Stochastic RSI and Commodity Channel Index (CCI) are neutral. Bull/Bear Power (BBP) at 0.41 shows buyers dominate intraday momentum in an oversold context, while the Awesome Oscillator (AO) is negative and also forecasts "Sell," reinforcing the current downtrend. Price is positioned near the day’s low, and intraday volatility stands at 3.02%, indicating clear downward pressure after the open.
Previously it was reported that Enphase Energy faced persistent technical weakness and a sustained bearish outlook despite commercial product developments. The current analysis reinforces this negative trend, with downside risk prevailing and support at $37.10 emerging as a critical level for traders to monitor in the near term.





Latest Enphase Energy News



-
 Afghanistan
-
 Albania
-
 Algeria
-
 Angola
-
 Argentina
-
 Armenia
-
 Australia
-
 Austria
-
 Azerbaijan
-
 Bahamas
-
 Bahrain
-
 Bangladesh
-
 Belarus
-
 Belgium
-
 Bolivia
-
 Botswana
-
 Brazil
-
 Brunei
-
 Bulgaria
-
 Cambodia
-
 Cameroon
-
 Canada
-
 Chile
Chile
-
 China
China
-
 Colombia
-
 Congo
Congo
-
 Costa Rica
-
 Cote d'Ivoire
-
 Croatia
-
 Cuba
Cuba
-
 Cyprus
-
 Czechia
-
 DR Congo
-
 Denmark
-
 Dominican Republic
-
 Ecuador
-
 Egypt
Egypt
-
 El Salvador
-
 Estonia
-
 Eswatini
-
 Ethiopia
-
 Finland
-
 France
-
 Georgia
-
 Germany
-
 Ghana
Ghana
-
 Greece
-
 Haiti
Haiti
-
 Hong Kong
-
 Hungary
-
 India
India
-
 Indonesia
-
 Iran, Islamic republic
-
 Iraq
Iraq
-
 Ireland
-
 Israel
-
 Italy
Italy
-
 Jamaica
-
 Japan
Japan
-
 Jordan
-
 Kazakhstan
-
 Kenya
Kenya
-
 Korea
Korea
-
 Kuwait
-
 Kyrgyzstan
-
 Laos
Laos
-
 Latvia
-
 Lebanon
-
 Lesotho
-
 Libya
Libya
-
 Lithuania
-
 Luxembourg
-
 Madagascar
-
 Malaysia
-
 Malta
Malta
-
 Mauritius
-
 Mexico
-
 Moldova
-
 Mongolia
-
 Montenegro
-
 Morocco
-
 Mozambique
-
 Myanmar
-
 Namibia
-
 Nepal
Nepal
-
 Netherlands
-
 New Zealand
-
 Nigeria
-
 North Macedonia
-
 Norway
-
 Oman
Oman
-
 Pakistan
-
 Palestine
-
 Panama
-
 Papua New Guinea
-
 Paraguay
-
 Peru
Peru
-
 Philippines
-
 Poland
-
 Portugal
-
 Puerto Rico
-
 Qatar
Qatar
-
 Reunion
-
 Romania
-
 Rwanda
-
 Saudi Arabia
-
 Serbia
-
 Singapore
-
 Slovakia
-
 Slovenia
-
 Somalia
-
 South Africa
-
 Spain
Spain
-
 Sri Lanka
-
 Sweden
-
 Switzerland
-
 Syria
Syria
-
 Taiwan
-
 Tajikistan
-
 Tanzania
-
 Thailand
-
 Trinidad and Tobago
-
 Tunisia
-
 Turkey
-
 UAE
UAE
-
 Uganda
-
 Ukraine
-
 United Kingdom
-
United States
-
 Uruguay
-
 Uzbekistan
-
 Venezuela
-
 Vietnam
-
 Yemen
Yemen
-
 Zambia
-
 Zimbabwe
- Forex
- Crypto












