

Dutch Bros shares technical analysis: Approaches $57.47 resistance

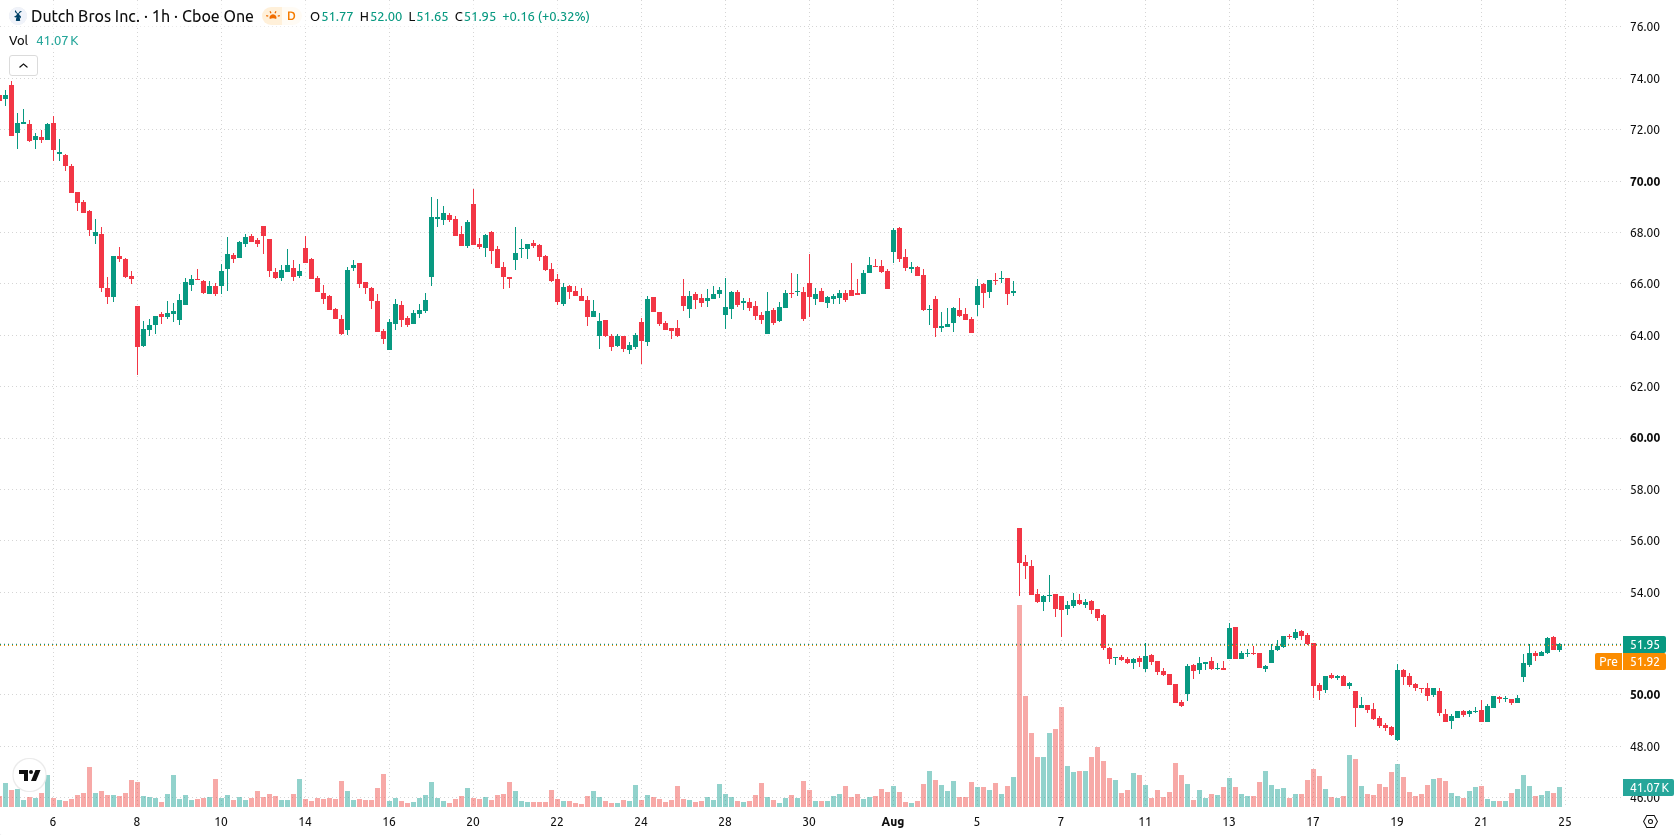
Dutch Bros (BROS) stock is trading at $51.95 after a daily rise of 4.17%. The stock sits above its key moving averages.
 36.61
45.44
Highlights
- BROS/USD shows short- and medium-term bullish momentum with price above key moving averages but remains below long-term levels.
- Multiple overbought indicators and a 4.17% gap-driven surge to $51.95 suggest strong current buying but also increased pullback risk.
- The next several sessions are expected to see price between $50.08 to $53.82, with a 64% probability of an upward move.
Bullish momentum builds as buyers test overbought conditions
On the hourly chart, BROS is positioned above both its MA-20 at $50.25 and MA-50 at $50.4, while long-term resistance remains at the MA-200 set at $57.47. The Ichimoku Kijun offers immediate support at $50.45. MACD and ADX confirm a Buy setup, with RSI elevated at 64.6 and oscillators such as Stochastic RSI, CCI, and Bull/Bear Power all registering overbought conditions, pointing to robust buyer engagement. Meanwhile, the Awesome Oscillator stays neutral, neither validating nor opposing the prevailing trend.
Consolidation likely amid breakout risk and increased volatility
In the near term, BROS is expected to fluctuate within a pricing band of $50.08 to $53.82. With upward breakout probability estimated at 64%, continued gains may occur if resistance is breached, potentially testing the upper end of this range. On the downside, a slip below immediate support may result in further retracement toward the lower boundary. The most probable scenario is short-term consolidation within these levels amid heightened intraday volatility.
Earlier, analysts noted that Dutch Bros was constrained by persistent technical pressures and ongoing downside risk. The latest action signals a notable shift in short-term momentum, but with volatility elevated, traders should monitor the $50.08–$53.82 range as consolidation remains the most probable scenario.










-
 Afghanistan
-
 Albania
-
 Algeria
-
 Angola
-
 Argentina
-
 Armenia
-
 Australia
-
 Austria
-
 Azerbaijan
-
 Bahamas
-
 Bahrain
-
 Bangladesh
-
 Belarus
-
 Belgium
-
 Bolivia
-
 Botswana
-
 Brazil
-
 Brunei
-
 Bulgaria
-
 Cambodia
-
 Cameroon
-
 Canada
-
 Chile
-
 China
-
 Colombia
-
 Congo
-
 Costa Rica
-
 Cote d'Ivoire
-
 Croatia
-
 Cuba
-
 Cyprus
-
 Czechia
-
 DR Congo
-
 Denmark
-
 Dominican Republic
-
 Ecuador
-
 Egypt
-
 El Salvador
-
 Estonia
-
 Eswatini
-
 Ethiopia
-
 Finland
-
 France
-
 Georgia
-
 Germany
-
 Ghana
-
 Greece
-
 Haiti
-
 Hong Kong
-
 Hungary
-
 India
-
 Indonesia
-
 Iran, Islamic republic
-
 Iraq
-
 Ireland
-
 Israel
-
 Italy
-
 Jamaica
-
 Japan
-
 Jordan
-
 Kazakhstan
-
 Kenya
-
 Korea
-
 Kuwait
-
 Kyrgyzstan
-
 Laos
-
 Latvia
-
 Lebanon
-
 Lesotho
-
 Libya
-
 Lithuania
-
 Luxembourg
-
 Madagascar
-
 Malaysia
-
 Malta
-
 Mauritius
-
 Mexico
-
 Moldova
-
 Mongolia
-
 Montenegro
-
 Morocco
-
 Mozambique
-
 Myanmar
-
 Namibia
-
 Nepal
-
 Netherlands
-
 New Zealand
-
 Nigeria
-
 North Macedonia
-
 Norway
-
 Oman
-
 Pakistan
-
 Palestine
-
 Panama
-
 Papua New Guinea
-
 Paraguay
-
 Peru
-
 Philippines
-
 Poland
-
 Portugal
-
 Puerto Rico
-
 Qatar
-
 Reunion
-
 Romania
-
 Rwanda
-
 Saudi Arabia
-
 Serbia
-
 Singapore
-
 Slovakia
-
 Slovenia
-
 Somalia
-
 South Africa
-
 Spain
-
 Sri Lanka
-
 Sweden
-
 Switzerland
-
 Syria
-
 Taiwan
-
 Tajikistan
-
 Tanzania
-
 Thailand
-
 Trinidad and Tobago
-
 Tunisia
-
 Turkey
-
 UAE
-
 Uganda
-
 Ukraine
-
 United Kingdom
-
United States
-
 Uruguay
-
 Uzbekistan
-
 Venezuela
-
 Vietnam
-
 Yemen
-
 Zambia
-
 Zimbabwe
- Forex
- Crypto












