

Lululemon shares drop more than 4% after cautious 2026 outlook and key executive shifts

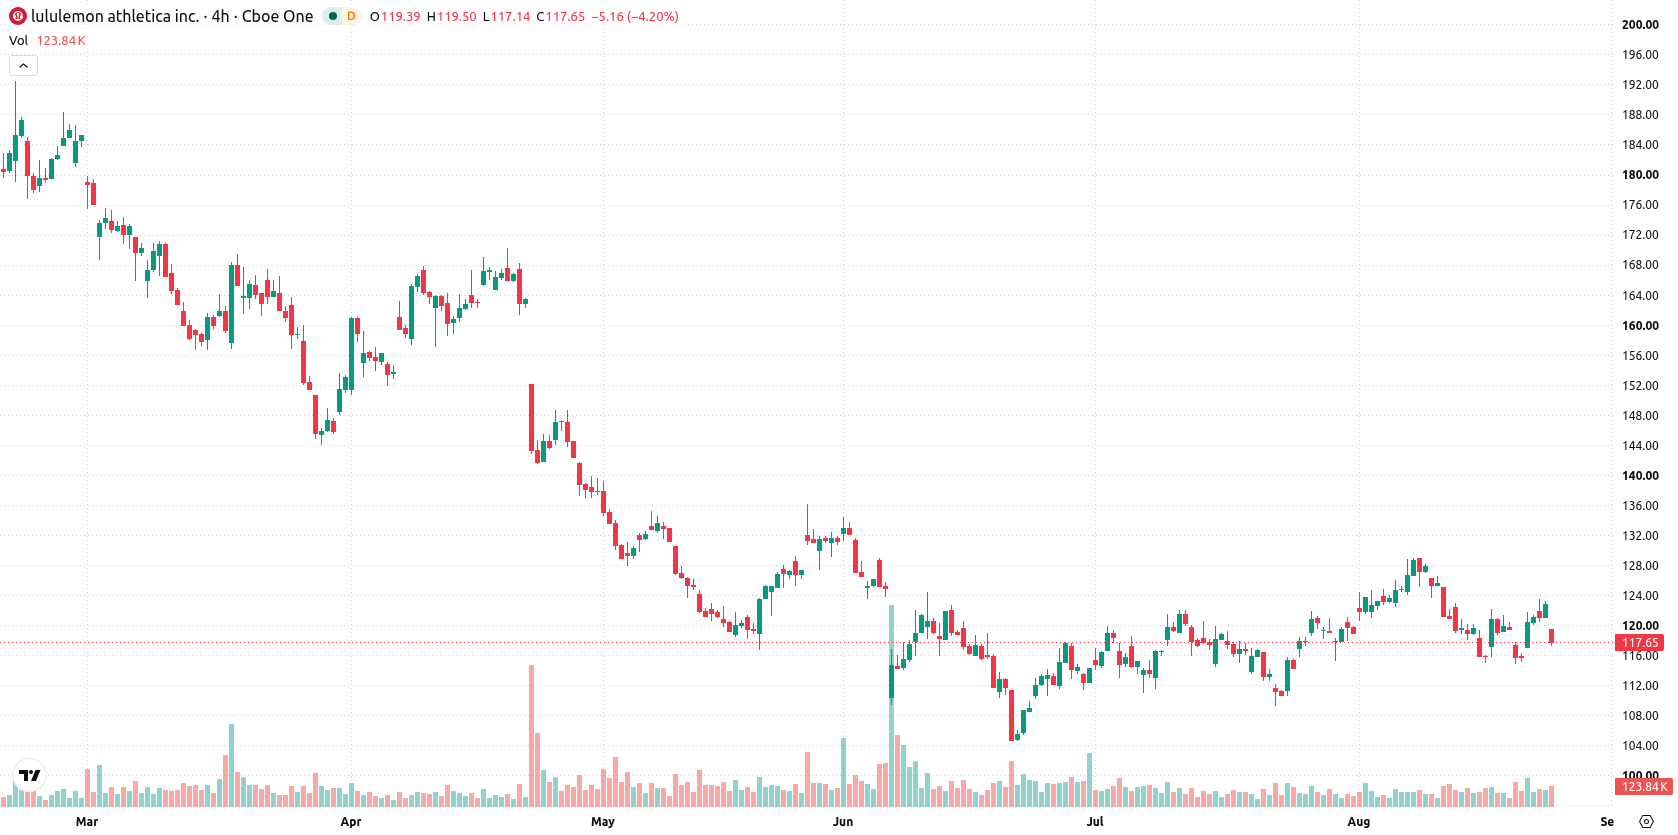
Lululemon Athletica (LULU) fell 4.2% after Q1 results showed slower growth, margin pressures, and a cautious outlook for the remainder of 2026. The scale of the decline is reinforced by the stock now trading below its key 20-, 50-, and 200-day moving averages, which signals sustained bearish pressure.
 110.15
111.62
Highlights
- Lululemon reported slower Q1 2026 growth, margin compression, and a more cautious full-year outlook.
- The company allocated EUR 331 million to share repurchases and opened five new stores, reaching 816 locations.
- Shares of Lululemon trade below key moving averages with a 5-day expected range of $113.22 to $122.02, momentum signals remain mixed.
Major share buybacks and CEO transition countered by persistent selling
Lululemon reported Q1 2026 results that included slower growth, margin compression, and a more cautious full-year outlook. During the quarter, the company allocated EUR 331 million for share repurchases and expanded its global footprint by opening five new stores, bringing its total to 816. Incoming CEO Heidi O’Neill is set to take over following the departures of key executives, and major institutional investors established new stakes in the company in the second quarter, though price action has remained under broader selling pressure.
Bearish multi-horizon averages offset by mixed momentum signals
Lululemon is now trading below its 20-day ($121.42), 50-day ($117.65), and 200-day ($155.08) moving averages, indicating bearish pressure across short-, medium-, and long-term horizons. The nearest ceiling is set at $117.65, with support at $117.35, and the Ichimoku Kijun at $119.03 acts as resistance. The overall MA-50 vs MA-200 alignment remains bearish. Momentum readings are mixed: MACD and Awesome Oscillator both show strong buy signals, while RSI at 54.36 suggests a buy setup but is not overbought. CCI and Stochastic RSI are neutral, and Bull/Bear Power at 3.06 reveals buyers dominate intraday action, though an 'Overbought' reading introduces caution. The stock fell $5.16, or 4.2%, after opening with a downside gap of $4.16 (3.39%). It is near session lows, with intraday volatility at 1.87%, highlighting ongoing post-open pressure. Divergent momentum and oscillator signals highlight instability as both downside and upside forces appear intraday.
Earlier, analysts noted that Lululemon was under persistent long-term bearish pressure driven by leadership uncertainty and ongoing executive departures. The stock’s continued struggle below all major moving averages and the emergence of new institutional investors reinforce the importance of monitoring the $117.65 resistance level, as a sustained break above or below this threshold may dictate near-term direction.






Latest Lululemon Athletica News





-
 Afghanistan
-
 Albania
-
 Algeria
-
 Angola
-
 Argentina
-
 Armenia
-
 Australia
-
 Austria
-
 Azerbaijan
-
 Bahamas
-
 Bahrain
-
 Bangladesh
-
 Belarus
-
 Belgium
-
 Bolivia
-
 Botswana
-
 Brazil
-
 Brunei
-
 Bulgaria
-
 Cambodia
-
 Cameroon
-
 Canada
-
 Chile
-
 China
-
 Colombia
-
 Congo
-
 Costa Rica
-
 Cote d'Ivoire
-
 Croatia
-
 Cuba
-
 Cyprus
-
 Czechia
-
 DR Congo
-
 Denmark
-
 Dominican Republic
-
 Ecuador
-
 Egypt
-
 El Salvador
-
 Estonia
-
 Eswatini
-
 Ethiopia
-
 Finland
-
 France
-
 Georgia
-
 Germany
-
 Ghana
-
 Greece
-
 Haiti
-
 Hong Kong
-
 Hungary
-
 India
-
 Indonesia
-
 Iran, Islamic republic
-
 Iraq
-
 Ireland
-
 Israel
-
 Italy
-
 Jamaica
-
 Japan
-
 Jordan
-
 Kazakhstan
-
 Kenya
-
 Korea
-
 Kuwait
-
 Kyrgyzstan
-
 Laos
-
 Latvia
-
 Lebanon
-
 Lesotho
-
 Libya
-
 Lithuania
-
 Luxembourg
-
 Madagascar
-
 Malaysia
-
 Malta
-
 Mauritius
-
 Mexico
-
 Moldova
-
 Mongolia
-
 Montenegro
-
 Morocco
-
 Mozambique
-
 Myanmar
-
 Namibia
-
 Nepal
-
 Netherlands
-
 New Zealand
-
 Nigeria
-
 North Macedonia
-
 Norway
-
 Oman
-
 Pakistan
-
 Palestine
-
 Panama
-
 Papua New Guinea
-
 Paraguay
-
 Peru
-
 Philippines
-
 Poland
-
 Portugal
-
 Puerto Rico
-
 Qatar
-
 Reunion
-
 Romania
-
 Rwanda
-
 Saudi Arabia
-
 Serbia
-
 Singapore
-
 Slovakia
-
 Slovenia
-
 Somalia
-
 South Africa
-
 Spain
-
 Sri Lanka
-
 Sweden
-
 Switzerland
-
 Syria
-
 Taiwan
-
 Tajikistan
-
 Tanzania
-
 Thailand
-
 Trinidad and Tobago
-
 Tunisia
-
 Turkey
-
 UAE
-
 Uganda
-
 Ukraine
-
 United Kingdom
-
United States
-
 Uruguay
-
 Uzbekistan
-
 Venezuela
-
 Vietnam
-
 Yemen
-
 Zambia
-
 Zimbabwe
- Forex
- Crypto












