

What's behind Cadence Design Systems's latest 4.1% stock surge?

Cadence Design Systems Inc (CDNS) climbed 4.08% in a sharp intraday move driven by a technical rebound from oversold conditions and strong intraday volatility. This rise contradicts the prevailing bearish momentum signals, as the stock remains below both its 20-day and 50-day moving averages, which suggests the move is not broadly confirmed by underlying technical trends.
 320.55
333.01
Highlights
- Cadence Design Systems stock trades below key short-term averages but remains above long-term support near $326.99.
- Momentum indicators confirm persistent weakness and oversold conditions, but strong intraday gains present an unconfirmed upside move.
- Expected five-day range is $322.07 to $338.35, with a low probability of gains and a baseline scenario of sideways trading.
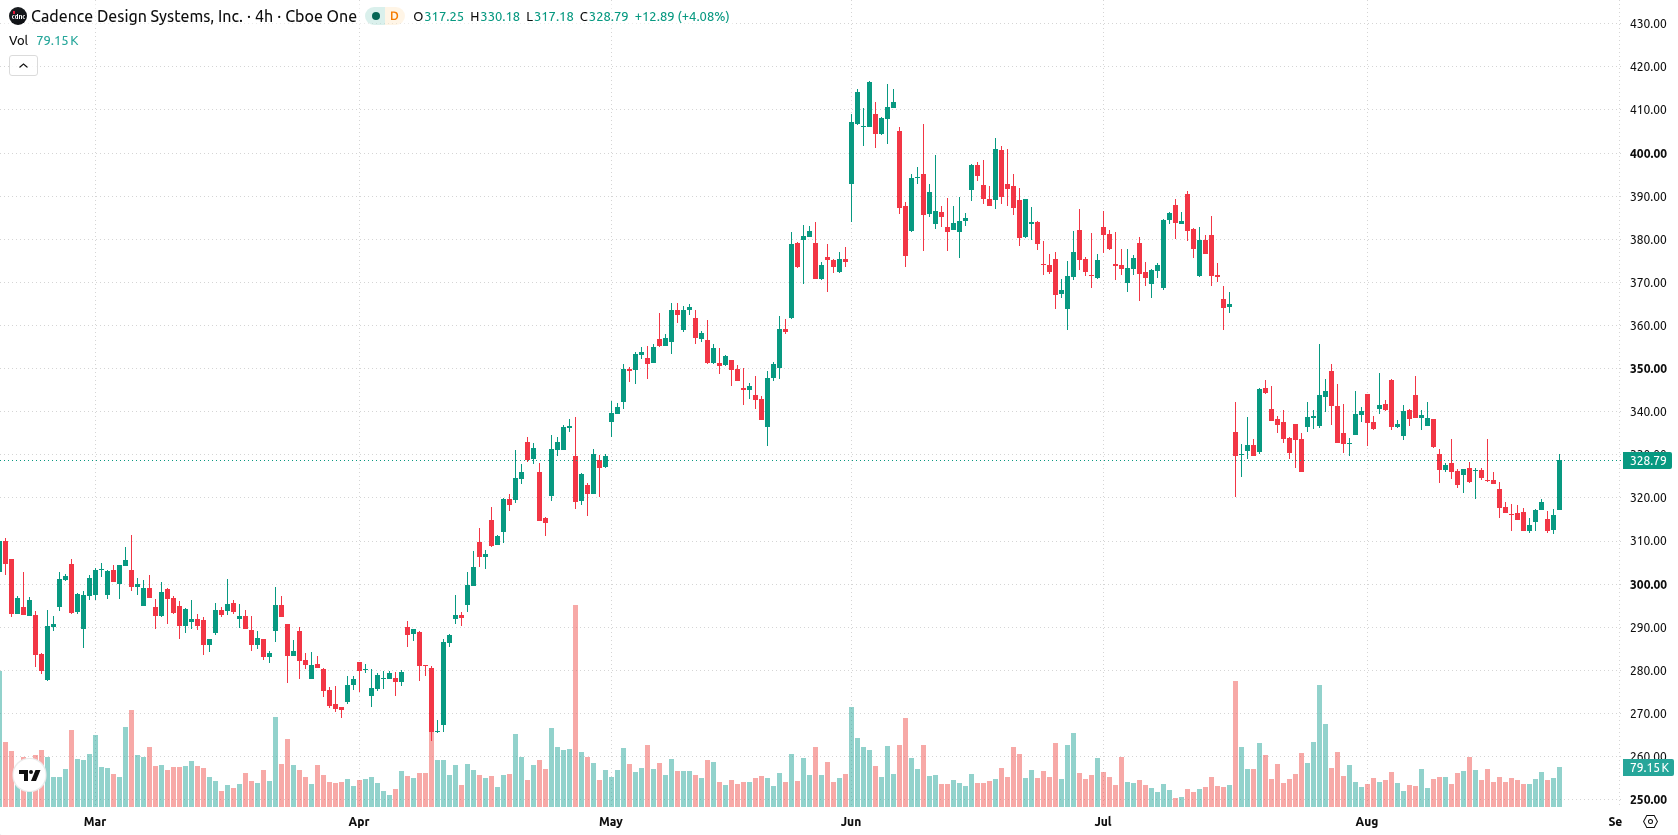
Mixed average positions and negative momentum underscore resistance tests
Cadence Design Systems trades just below the 20-day moving average at $328.82 and remains under the 50-day at $352.49, but it is currently above the 200-day at $326.99. This mixed positioning signals lingering medium-term selling pressure, resilient long-term support, and a test of resistance at the near-term ceiling of $328.82, with nearby support at today's high of $328.5. Momentum indicators highlight persistent weakness. The Moving Average Convergence Divergence (MACD) is negative and forecasts further selling, while the Average Directional Index (ADX) signals low trend strength. The Relative Strength Index (RSI) at 35.38 and Commodity Channel Index (CCI) at -109.45 both indicate oversold conditions. Stochastic RSI and the Awesome Oscillator call for caution with neutral readings. Bull/Bear Power (BBP) is negative at -5.89, demonstrating clear seller dominance and further oversold conditions intraday. The stock is up $12.89 (4.08%) after opening with a $2.51 upside gap and has pushed near the high of its daily range, with intraday volatility amplitude at 3.40%. There is some divergence between strong intraday action and overwhelmingly bearish momentum signals, suggesting this upward move is not broadly confirmed by technical momentum.
Earlier, analysts noted that Cadence Design Systems had drawn attention after a significant share price pullback, as investors weighed the longer-term implications of AI-driven demand against near-term volatility. The current technical setup adds a new dimension, highlighting that despite this latest intraday rebound, a sustained break above resistance at $328.82 is necessary to shift the baseline scenario away from continued sideways trading within the $322.07 to $338.35 range.






Latest Cadence Design Systems Inc News





-
 Afghanistan
-
 Albania
-
 Algeria
-
 Angola
-
 Argentina
-
 Armenia
-
 Australia
-
 Austria
-
 Azerbaijan
-
 Bahamas
-
 Bahrain
-
 Bangladesh
-
 Belarus
-
 Belgium
-
 Bolivia
-
 Botswana
-
 Brazil
-
 Brunei
-
 Bulgaria
-
 Cambodia
-
 Cameroon
-
 Canada
-
 Chile
-
 China
-
 Colombia
-
 Congo
-
 Costa Rica
-
 Cote d'Ivoire
-
 Croatia
-
 Cuba
-
 Cyprus
-
 Czechia
-
 DR Congo
-
 Denmark
-
 Dominican Republic
-
 Ecuador
-
 Egypt
-
 El Salvador
-
 Estonia
-
 Eswatini
-
 Ethiopia
-
 Finland
-
 France
-
 Georgia
-
 Germany
-
 Ghana
-
 Greece
-
 Haiti
-
 Hong Kong
-
 Hungary
-
 India
-
 Indonesia
-
 Iran, Islamic republic
-
 Iraq
-
 Ireland
-
 Israel
-
 Italy
-
 Jamaica
-
 Japan
-
 Jordan
-
 Kazakhstan
-
 Kenya
-
 Korea
-
 Kuwait
-
 Kyrgyzstan
-
 Laos
-
 Latvia
-
 Lebanon
-
 Lesotho
-
 Libya
-
 Lithuania
-
 Luxembourg
-
 Madagascar
-
 Malaysia
-
 Malta
-
 Mauritius
-
 Mexico
-
 Moldova
-
 Mongolia
-
 Montenegro
-
 Morocco
-
 Mozambique
-
 Myanmar
-
 Namibia
-
 Nepal
-
 Netherlands
-
 New Zealand
-
 Nigeria
-
 North Macedonia
-
 Norway
-
 Oman
-
 Pakistan
-
 Palestine
-
 Panama
-
 Papua New Guinea
-
 Paraguay
-
 Peru
-
 Philippines
-
 Poland
-
 Portugal
-
 Puerto Rico
-
 Qatar
-
 Reunion
-
 Romania
-
 Rwanda
-
 Saudi Arabia
-
 Serbia
-
 Singapore
-
 Slovakia
-
 Slovenia
-
 Somalia
-
 South Africa
-
 Spain
-
 Sri Lanka
-
 Sweden
-
 Switzerland
-
 Syria
-
 Taiwan
-
 Tajikistan
-
 Tanzania
-
 Thailand
-
 Trinidad and Tobago
-
 Tunisia
-
 Turkey
-
 UAE
-
 Uganda
-
 Ukraine
-
 United Kingdom
-
United States
-
 Uruguay
-
 Uzbekistan
-
 Venezuela
-
 Vietnam
-
 Yemen
-
 Zambia
-
 Zimbabwe
- Forex
- Crypto












