

Why is Cadence Design Systems stock down 3.2% today?

Cadence Design Systems Inc (CDNS) dropped 3.2% as sustained selling pressure prevailed and the stock opened with a downside gap. The move is supported by the price remaining below all key moving averages and ongoing negative momentum, with multiple resistance levels overhead reinforcing the bearish tone.
 316.85
339.25
Highlights
- Shares of Cadence Design Systems are trading below key moving averages at $312.8, indicating sustained selling pressure across multiple timeframes.
- Mixed technical indicators show neutral momentum, with buyer activity present intraday but overall trend lacking clear direction.
- Expected trading range for the next five days is $303.2 to $324.84, with over 80% probability of a downward move and baseline scenario projecting sideways price action.
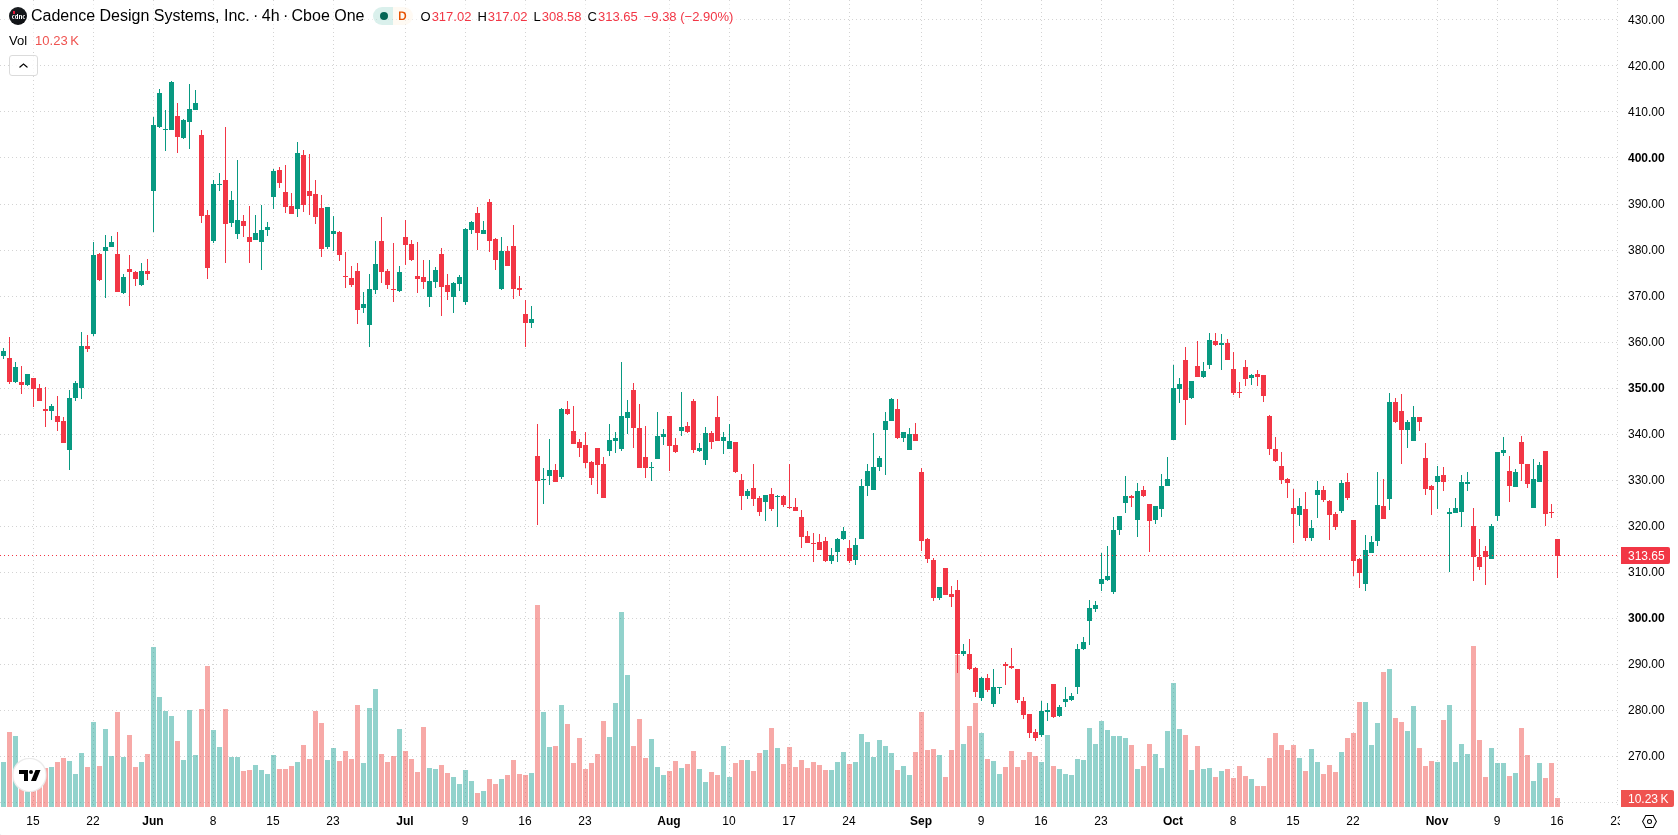
Persistent negative trend as price lags major moving averages
Cadence Design Systems is trading below its 20-day, 50-day, and 200-day moving averages at $327.27, $320.86, and $328.09, which highlights selling pressure across short-, medium-, and long-term periods. The near-term resistance is set at $319.5 and immediate support sits at $308, with distant moving averages above price indicating a persistent negative trend. Momentum indicators are mixed: the MACD suggests continued buying interests, yet the ADX is neutral. RSI, Stochastic RSI, and CCI are all neutral, pointing to a lack of extreme conditions. Bull/Bear Power indicates intraday buyers are present, but the Awesome Oscillator remains neutral. The price action is mid-range for the day, and intraday volatility stands at 3.73%, underlining ongoing bearish pressure following the gap down.
Previously it was reported that Cadence Design Systems faced persistent technical weakness despite ongoing innovation and strategic initiatives. The current analysis reaffirms this bearish outlook with a high likelihood of further downside, making the $303.2 support level critical for traders to monitor in the coming days.











-
 Afghanistan
-
 Albania
-
 Algeria
-
 Angola
-
 Argentina
-
 Armenia
-
 Australia
-
 Austria
-
 Azerbaijan
-
 Bahamas
-
 Bahrain
-
 Bangladesh
-
 Belarus
-
 Belgium
-
 Bolivia
-
 Botswana
-
 Brazil
-
 Brunei
-
 Bulgaria
-
 Cambodia
-
 Cameroon
-
 Canada
-
 Chile
-
 China
-
 Colombia
-
 Congo
-
 Costa Rica
-
 Cote d'Ivoire
-
 Croatia
-
 Cuba
-
 Cyprus
-
 Czechia
-
 DR Congo
-
 Denmark
-
 Dominican Republic
-
 Ecuador
-
 Egypt
-
 El Salvador
-
 Estonia
-
 Eswatini
-
 Ethiopia
-
 Finland
-
 France
-
 Georgia
-
 Germany
-
 Ghana
-
 Greece
-
 Haiti
-
 Hong Kong
-
 Hungary
-
 India
-
 Indonesia
-
 Iran, Islamic republic
-
 Iraq
-
 Ireland
-
 Israel
-
 Italy
-
 Jamaica
-
 Japan
-
 Jordan
-
 Kazakhstan
-
 Kenya
-
 Korea
-
 Kuwait
-
 Kyrgyzstan
-
 Laos
-
 Latvia
-
 Lebanon
-
 Lesotho
-
 Libya
-
 Lithuania
-
 Luxembourg
-
 Madagascar
-
 Malaysia
-
 Malta
-
 Mauritius
-
 Mexico
-
 Moldova
-
 Mongolia
-
 Montenegro
-
 Morocco
-
 Mozambique
-
 Myanmar
-
 Namibia
-
 Nepal
-
 Netherlands
-
 New Zealand
-
 Nigeria
-
 North Macedonia
-
 Norway
-
 Oman
-
 Pakistan
-
 Palestine
-
 Panama
-
 Papua New Guinea
-
 Paraguay
-
 Peru
-
 Philippines
-
 Poland
-
 Portugal
-
 Puerto Rico
-
 Qatar
-
 Reunion
-
 Romania
-
 Rwanda
-
 Saudi Arabia
-
 Serbia
-
 Singapore
-
 Slovakia
-
 Slovenia
-
 Somalia
-
 South Africa
-
 Spain
-
 Sri Lanka
-
 Sweden
-
 Switzerland
-
 Syria
-
 Taiwan
-
 Tajikistan
-
 Tanzania
-
 Thailand
-
 Trinidad and Tobago
-
 Tunisia
-
 Turkey
-
 UAE
-
 Uganda
-
 Ukraine
-
 United Kingdom
-
United States
-
 Uruguay
-
 Uzbekistan
-
 Venezuela
-
 Vietnam
-
 Yemen
-
 Zambia
-
 Zimbabwe
- Forex
- Crypto












