

Cadence Design Systems stock plunges more than 4% after short-term pullback tests key support

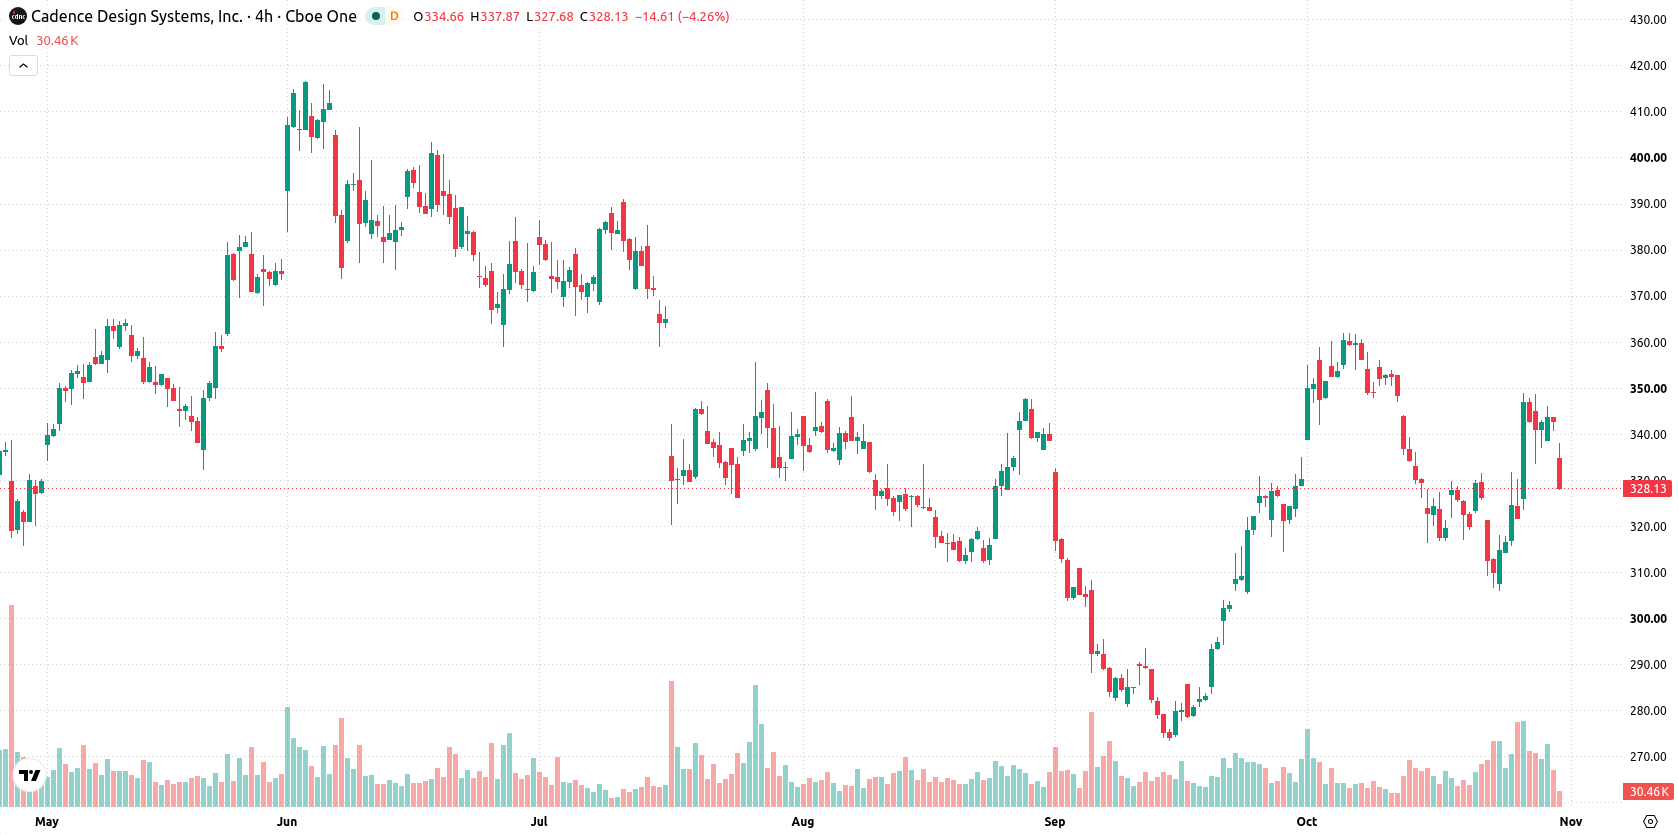
Cadence Design Systems Inc (CDNS) slid 4.18% after renewed selling pressure, even as the company reported continued advances in artificial intelligence initiatives and secured a place in the U.S. Department of Energy's Genesis Mission Consortium. The near-term downside move contradicts broader bullish technical signals, as the price remains sandwiched between medium- and long-term moving averages and is currently testing key support.
 326.27
331.48
Highlights
- Cadence Design Systems saw strong revenue growth linked to reinvestment strategies and public-private research initiatives in advanced microelectronics and AI.
- The company has joined the U.S. Department of Energy Genesis Mission Consortium to expand AI and high-performance computing development through new partnerships.
- Shares of Cadence Design Systems dropped 4.18% today and trade below short-term averages, but technical signals indicate an 80% probability of an upward move to $344.88 over the next five sessions.
Robust earnings and innovation offset by persistent selling pressure
Cadence Design Systems recorded strong financial performance driven by revenue growth and reinvestment strategies. The company recently joined the U.S. Department of Energy's Genesis Mission Consortium, expanding into public-private research partnerships focusing on advanced microelectronics and AI-driven innovation. These efforts align with broader initiatives to incorporate agentic AI and high-performance computing into its offerings, though price action has remained under broader selling pressure.
Mixed momentum as bearish medium-term signals contrast with bullish indicators
Cadence Design Systems is trading below its 20-day moving average ($336.44), but continues to hold above both the 50-day ($320.27) and 200-day ($327.47) moving averages—reflecting a short-term pullback within an otherwise bullish medium- to long-term framework. Immediate resistance is set at the Ichimoku Kijun level of $333.93, with support nearby at the session low of $327.51. The alignment between the 50-day and 200-day averages signals a bearish medium-term tilt. Momentum readings are mixed: the MACD shows a buy signal, ADX is neutral, and the RSI is in bullish territory. Stochastic RSI and CCI register neutrality. Bull/Bear Power (BBP) indicates buyers still dominate intraday momentum at 14.71, while an overbought signal calls for caution. The Awesome Oscillator highlights emerging bullish momentum, but intraday price action remains softer than momentum indicators suggest, creating a divergence between underlying sentiment and actual trading.
Previously it was reported that Cadence Design Systems expanded its AI strategy with the rollout of the Maestro portfolio, targeting greater control and efficiency for chipmakers. The current selloff, despite ongoing advancements and new research partnerships, highlights prevailing technical uncertainty, with traders advised to watch for price action around the $327.51 support as a key near-term inflection point.






Latest Cadence Design Systems Inc News





-
 Afghanistan
-
 Albania
-
 Algeria
-
 Angola
-
 Argentina
-
 Armenia
-
 Australia
-
 Austria
-
 Azerbaijan
-
 Bahamas
-
 Bahrain
-
 Bangladesh
-
 Belarus
-
 Belgium
-
 Bolivia
-
 Botswana
-
 Brazil
-
 Brunei
-
 Bulgaria
-
 Cambodia
-
 Cameroon
-
 Canada
-
 Chile
-
 China
-
 Colombia
-
 Congo
-
 Costa Rica
-
 Cote d'Ivoire
-
 Croatia
-
 Cuba
-
 Cyprus
-
 Czechia
-
 DR Congo
-
 Denmark
-
 Dominican Republic
-
 Ecuador
-
 Egypt
-
 El Salvador
-
 Estonia
-
 Eswatini
-
 Ethiopia
-
 Finland
-
 France
-
 Georgia
-
 Germany
-
 Ghana
-
 Greece
-
 Haiti
-
 Hong Kong
-
 Hungary
-
 India
-
 Indonesia
-
 Iran, Islamic republic
-
 Iraq
-
 Ireland
-
 Israel
-
 Italy
-
 Jamaica
-
 Japan
-
 Jordan
-
 Kazakhstan
-
 Kenya
-
 Korea
-
 Kuwait
-
 Kyrgyzstan
-
 Laos
-
 Latvia
-
 Lebanon
-
 Lesotho
-
 Libya
-
 Lithuania
-
 Luxembourg
-
 Madagascar
-
 Malaysia
-
 Malta
-
 Mauritius
-
 Mexico
-
 Moldova
-
 Mongolia
-
 Montenegro
-
 Morocco
-
 Mozambique
-
 Myanmar
-
 Namibia
-
 Nepal
-
 Netherlands
-
 New Zealand
-
 Nigeria
-
 North Macedonia
-
 Norway
-
 Oman
-
 Pakistan
-
 Palestine
-
 Panama
-
 Papua New Guinea
-
 Paraguay
-
 Peru
-
 Philippines
-
 Poland
-
 Portugal
-
 Puerto Rico
-
 Qatar
-
 Reunion
-
 Romania
-
 Rwanda
-
 Saudi Arabia
-
 Serbia
-
 Singapore
-
 Slovakia
-
 Slovenia
-
 Somalia
-
 South Africa
-
 Spain
-
 Sri Lanka
-
 Sweden
-
 Switzerland
-
 Syria
-
 Taiwan
-
 Tajikistan
-
 Tanzania
-
 Thailand
-
 Trinidad and Tobago
-
 Tunisia
-
 Turkey
-
 UAE
-
 Uganda
-
 Ukraine
-
 United Kingdom
-
United States
-
 Uruguay
-
 Uzbekistan
-
 Venezuela
-
 Vietnam
-
 Yemen
-
 Zambia
-
 Zimbabwe
- Forex
- Crypto












